Recent weeks have seen subtle yet significant changes in the Bitcoin market dynamics. After a prolonged decline throughout the first quarter of 2026, $BTC is currently trading at approximately $75.2k, surpassing the upper limit of its descending channel and entering the crucial resistance range between $75k and $80k. The pressing question now shifts from whether a recovery is underway to whether this recovery possesses sufficient structural support for sustainability.
Bitcoin Price Evaluation: Daily Chart Insights
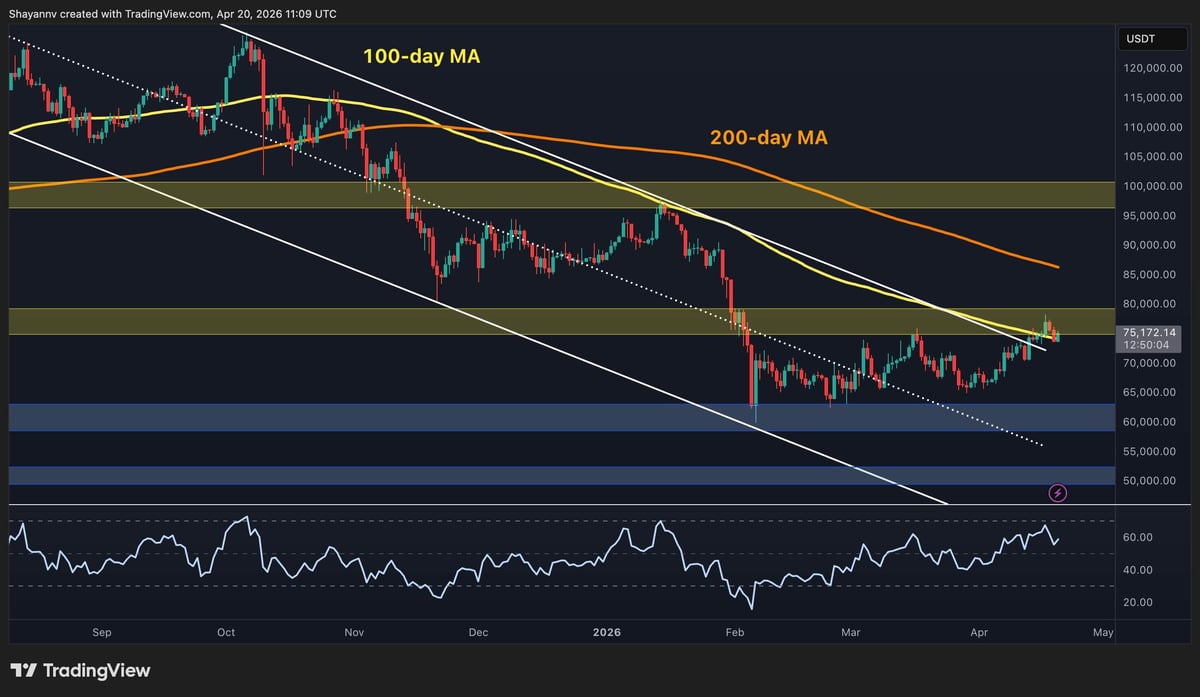
For several months, every attempt to recover on the daily chart faced resistance at the declining 100-day moving average (currently around ~$75k) and the upper boundary of its descending channel, ultimately failing to gain traction. However, this latest attempt stands out due to one key factor: since February, the RSI has been establishing higher lows while remaining far from overbought territory. This development has generated momentum beneath price movements, facilitating a breakout above both the 100-day MA and the channel’s upper boundary.
Nevertheless, $BTC finds itself firmly positioned within the $75k–$80k zone without having decisively broken through it yet. Successfully reclaiming this range on a closing basis—and more critically maintaining it during retests—would signify a genuine shift in market structure.
The major obstacles ahead include both the 200-day MA (~$85k) and supply levels ranging from $95k to $100k. Currently acting as initial support are both the 100-day MA just below current prices and former boundaries of around $73k–$74k; meanwhile, critical demand remains anchored at approximately $60k for this recovery phase.
$BTC/USDT Four-Hour Chart Analysis
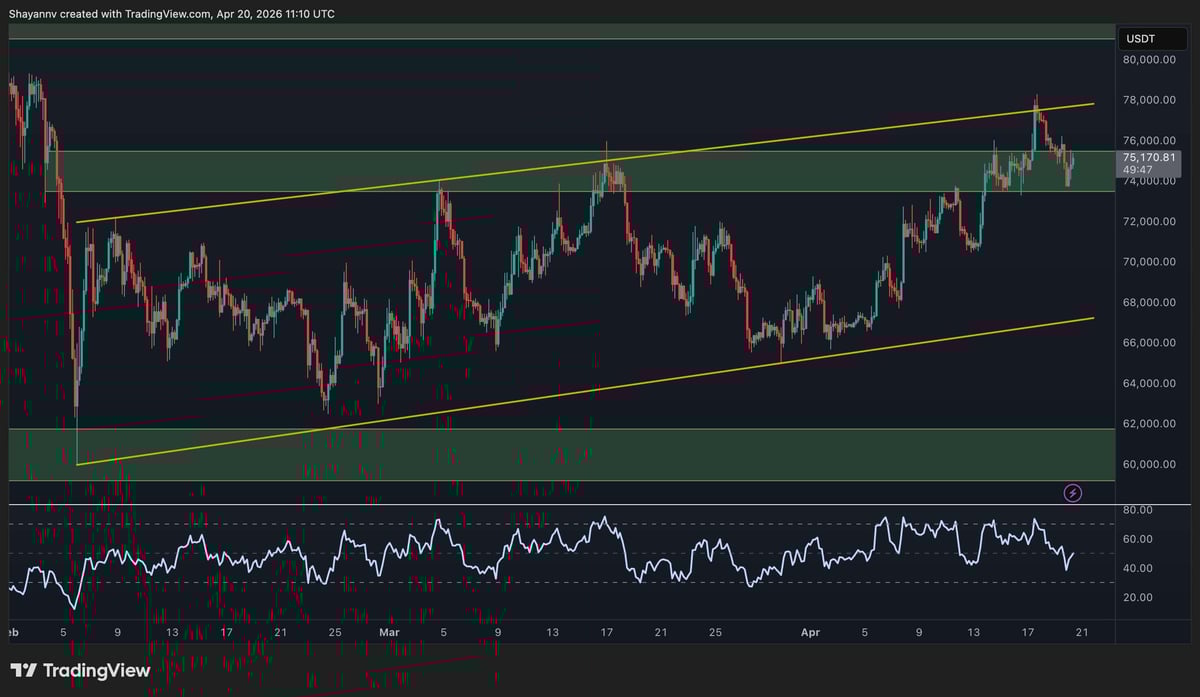
The ascending channel established since February’s lows has effectively guided price movements by creating an upward structure characterized by higher lows that propelled prices from around $60K up towards near-term highs between $77K-$78K—levels that $BTC reached earlier this week before experiencing some pullback. Currently consolidating near $75.2K positions Bitcoin just inside what was previously resistance but is now serving as support within a range of about $74K-$76K following recent rejections.
The RSI on this four-hour timeframe has also cooled down significantly from high-70s during recent upward moves down into mid-50s presently indicating short-term momentum easing off slightly; such pullbacks into prior resistance zones transitioning into support are textbook consolidation patterns with ample room left for buyers given that lower boundaries remain well below at roughly around mid-$68K area.
A successful move back above ($76K), accompanied by an RSI holding above 55 would signal readiness for another push toward reaching upper channels’ limits or even beyond towards hitting that elusive mark close to ($80).
Mood Analysis in Market Sentiment
The Estimated Leverage Ratio across various exchanges has witnessed notable increases recently with EMA(7) nearing levels close (to) .24 which approaches heights not seen since late last year’s bull run when $ BTC traded between ($110 K -$125 K). This indicates traders are engaging significantly more leverage relative against amounts held on exchanges while still being nearly forty percent lower than those previous peaks .
The implications here warrant careful consideration ; rising leverage could potentially fuel explosive upward movements if breakout occurs past (the ) threshold set at($80 K ), particularly under conditions where heavily leveraged long-side markets experience short squeezes , providing powerful accelerants pushing prices higher .
Conversely however elevated leverage amid uncertain structural foundations creates fragility risks ; should ($ BTC ) fail sustaining supports located near ($75 K ) rolling over might trigger cascading liquidations amplifying any downward pressures significantly thus highlighting decision time looming ahead regarding directionality acceleration forthcoming weeks will take place.