Bitcoin at a Crucial Technical Juncture
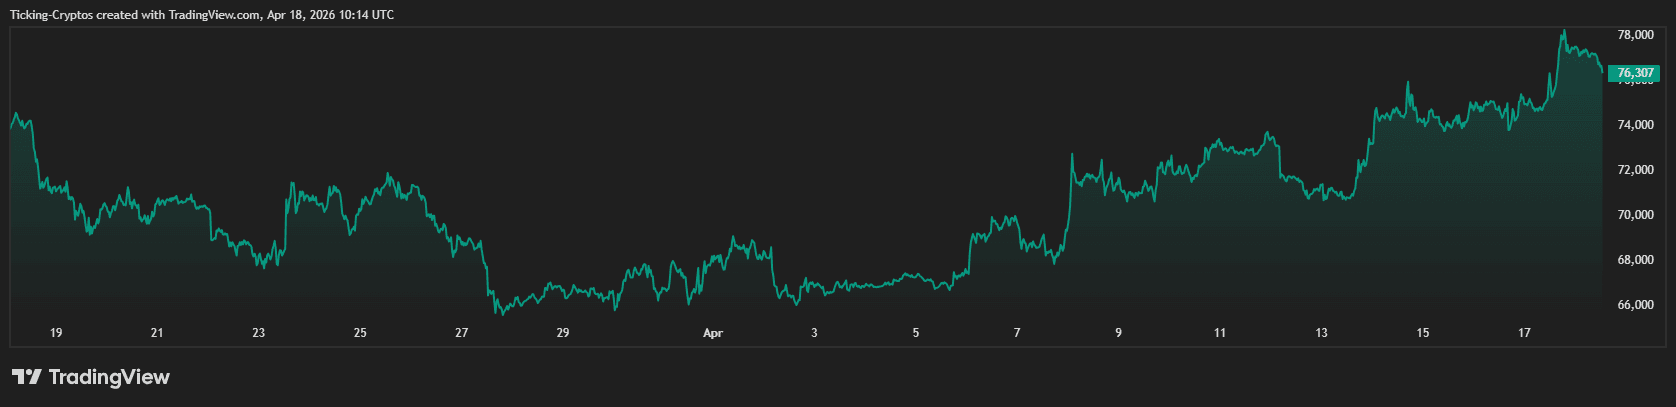
Bitcoin ($BTC) is currently approaching a crucial resistance threshold that may influence the market’s direction for the rest of Q2 2026. Following a phase of consolidation and volatility driven by geopolitical events, Bitcoin’s price has rallied back to the $77,000 – $78,000 range.
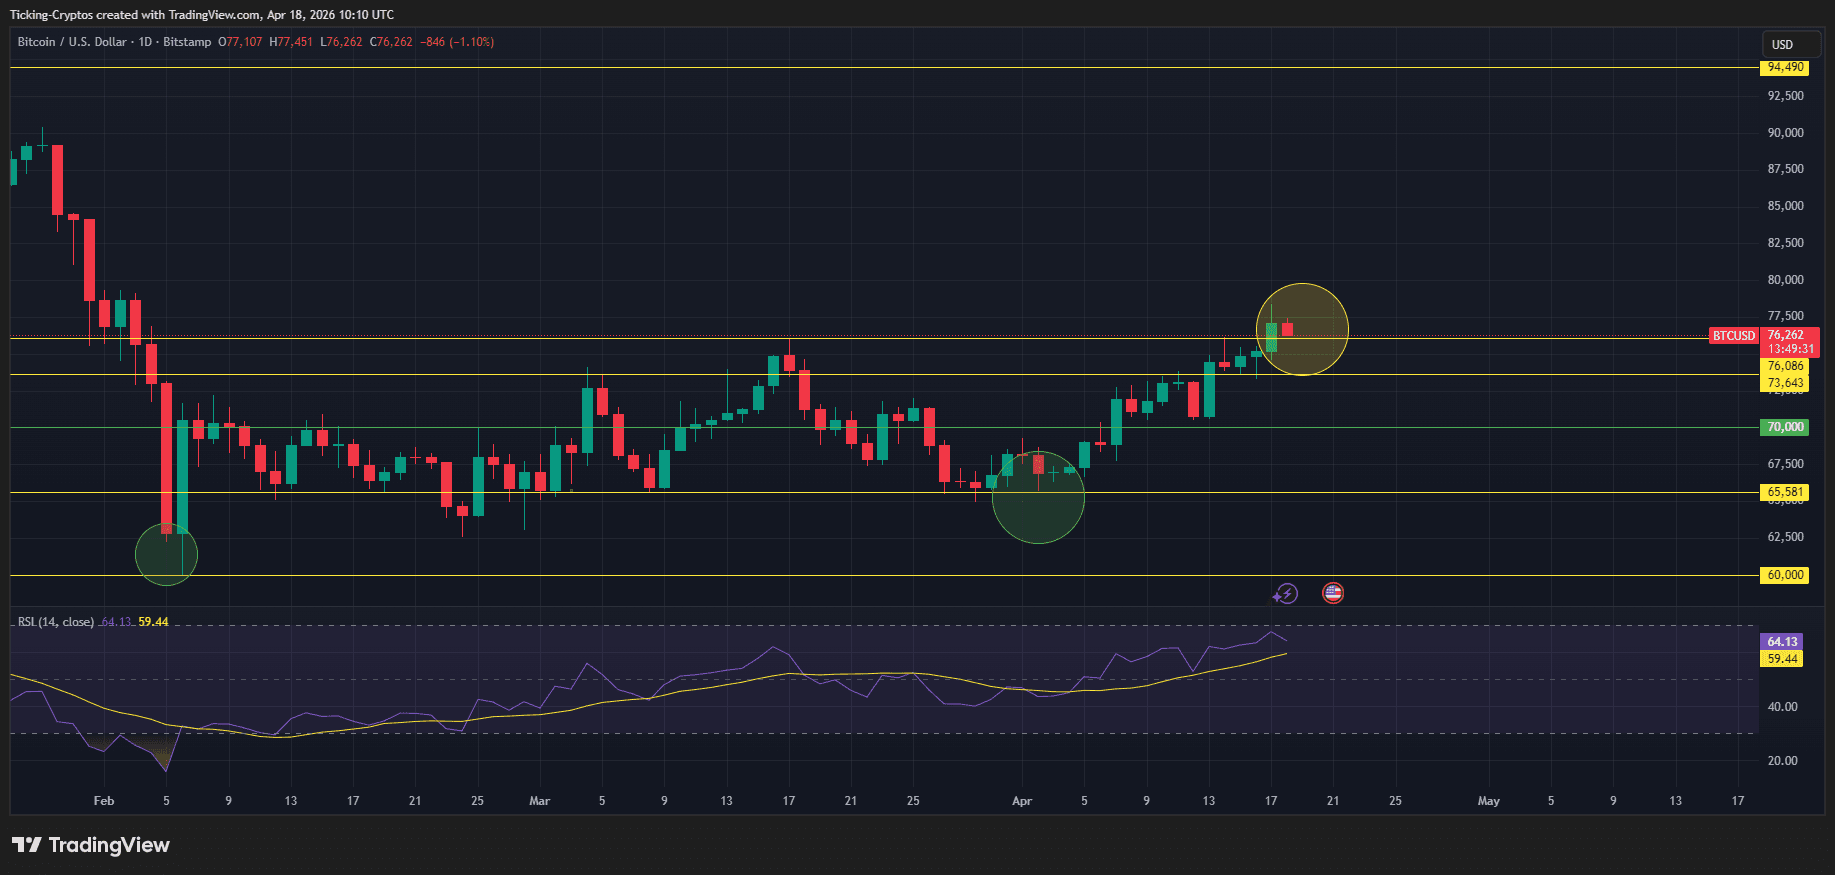
For both traders and long-term holders, attention is now fully directed toward this week’s candle close. Technical analysis indicates that if Bitcoin can convert the $78,000 level from resistance into support, it could pave the way for a swift rise towards the psychological barrier of $90,000.
Is This Breakout for $BTC Authentic?
The current market indicators affirm that Bitcoin is indeed pursuing a strong breakout. As of April 18, 2026, $BTC trades around $76,378 after reaching intraday peaks exceeding $78,000 earlier this week. This movement is underpinned by notable shifts in macroeconomic sentiment—particularly easing tensions in the Middle East and temporary reopening of key shipping routes like Hormuz—which have alleviated global inflation concerns and enhanced interest in “risk-on” assets.
Diving into the Significance of the $78K Resistance Level
A “breakout,” as defined in technical analysis terms occurs when an asset’s price surpasses an established resistance level with considerable trading volume. For Bitcoin specifically, crossing above $78K signifies more than just reaching another milestone; it represents a structural ceiling formed during early 2026’s turbulent fluctuations.
The Importance of Weekly Closing Prices
Dramatic daily price movements are often regarded as mere “noise.” In contrast to this perception; however—a weekly closing (Sunday midnight UTC) serves as a more dependable indicator reflecting institutional intentions.
- If above $78K: Confirms trend reversal while establishing new support levels for further upward momentum.
- If below $78K: Indicates market unpreparedness to sustain higher valuations likely leading to continued consolidation near approximately $70K.
Navigating Macro Influences Towards Price Projections
The present momentum derives from an ideal combination comprising fundamental factors alongside technical aspects:
- Macro Stability: The decline in crude oil prices following ceasefire discussions has redirected investments from commodities back into digital currencies.
- Persistent ETF Inflows: Institutional demand through spot ETFs remains strong with major entities such as Morgan Stanley’s MSBT absorbing selling pressure effectively.
- Cascading Liquidations: Data sourced from Coinglass suggests any move beyond $78.5k would trigger billions worth short position liquidations—providing essential fuel needed for potential climbs towards $85k.
Aiming Towards Price Targets: The Pathway to $90k
If bullish trends persist through weekly closes analysts are focusing on two primary targets ahead:
- Target One ($85k): The first significant Fibonacci extension point along with historical relevance.
- Target Two ($90k): A critical psychological benchmark likely enticing fresh retail investment enthusiasm.
An Insightful Look at Technical Analysis: RSI & Support Levels
An examination on $ BTC/USD chart reveals Relative Strength Index (RSI) currently resting around 64.13 indicating robust bullish energy without yet entering “overbought” territory (typically defined above70)—implying sufficient room remains available before necessitating any cooling off period .