Bitcoin has surged to the vicinity of $75,000 as traders observe two promising bullish patterns emerging on both monthly and daily charts. One of these charts indicates that $BTC is maintaining its position between previous all-time highs, while the other suggests increasing pressure near a breakout point that could potentially lead to a rise towards $80,000.
Bitcoin Remains Confined Between Significant Historical Highs
The cryptocurrency continues to trade within two critical resistance and support zones derived from its historical peaks in 2021 and 2024. According to Rekt Capital’s analysis, the $BTC/USD pair on the monthly chart is hovering above the 2021 high of approximately $69,185 but faces challenges in reclaiming the 2024 peak around $73,884. Consequently, Bitcoin’s price remains constrained within a tight historical range rather than initiating a new breakout.
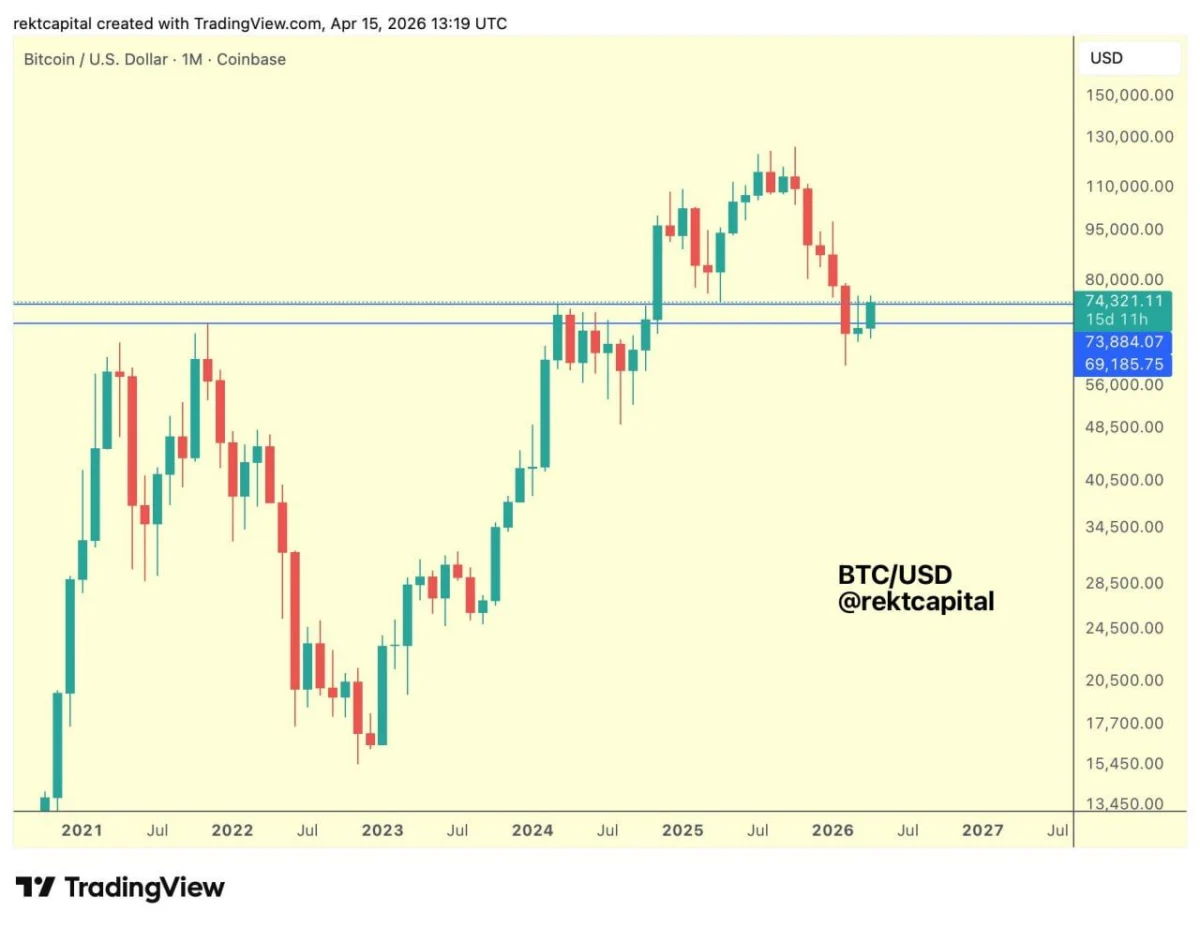
Source: Rekt Capital on X
Simultaneously, Bitcoin has already revisited the 2021 all-time high as support on its weekly chart according to Rekt Capital. This is significant because former resistance levels often transform into new support during bullish market phases. However, this retest has yet to be confirmed by the monthly chart; thus far, stronger confirmation from higher timeframes remains absent.
Additonally, Bitcoin continues facing rejection at the zone corresponding with its 2024 all-time high. The price recently retraced after surpassing $100,000 before settling back into low $70K territory. Despite buyers defending this lower boundary once more,$BTC has not managed a weekly close above this crucial resistance level for 2024. Until such an event occurs, it will remain trapped between support near its 2021 peak and resistance near its recent highs from 2024.
If Bitcoin manages to secure a weekly close beyond this threshold for all-time highs in 2024 , it could pave the way for prices advancing into upper ranges around $70K-$80K—indicating stronger momentum and possibly signaling an exit from this compression phase. For now though,the market structure stays confined within these historic boundaries.
Aiming for $80K as Descending Resistance Begins To Break Down
The daily chart illustrates how Bitcoin is approaching an essential breakout area after several months spent beneath a declining trendline which had limited upward movement since late-2015 . However ,recently,Bitcoin seems poised back inside that zone while simultaneously ascending through an upward blue channel—suggesting improved structural strength compared with earlier downtrends .
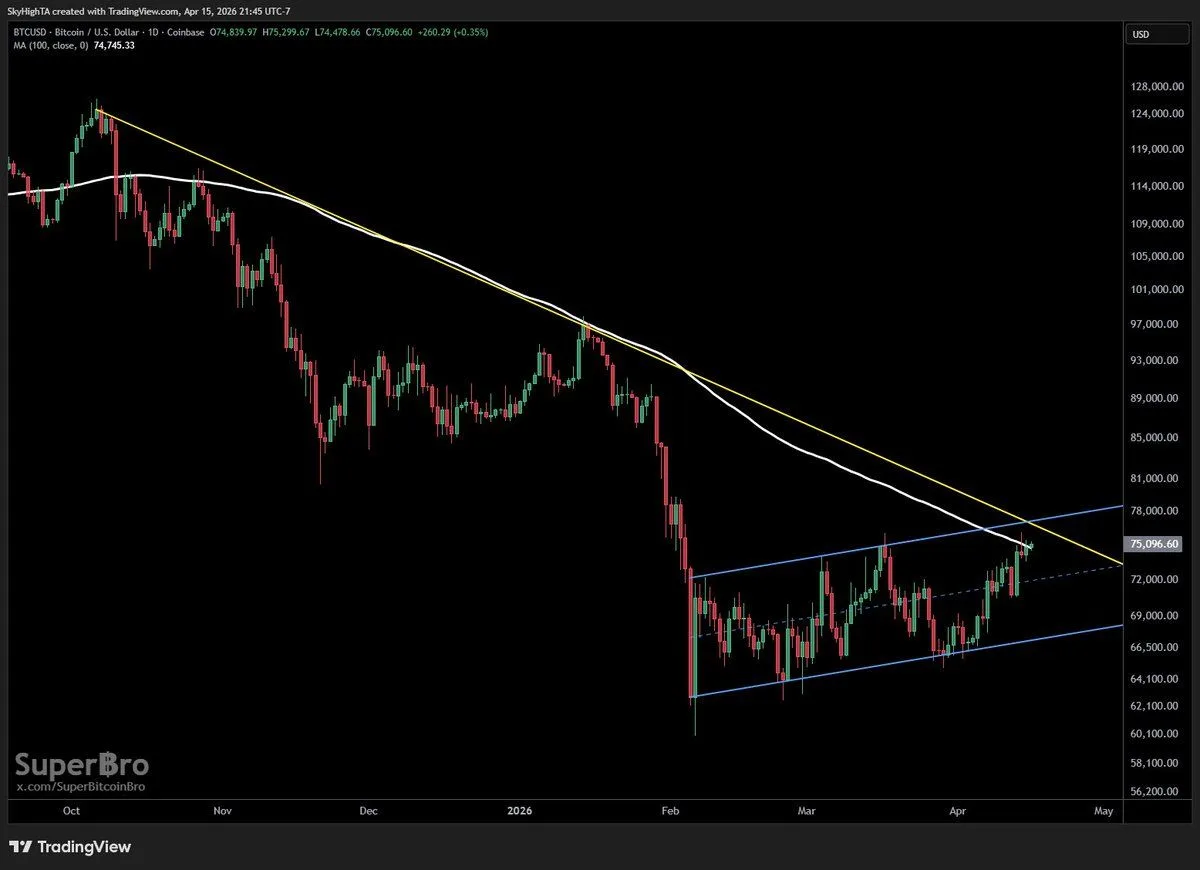
$BTC/USD daily chart source:
TradingView , Super฿ro on X
The analysis also shows that Bitcoin has reclaimed its position above the hundred-day moving average while testing where both falling resistances converge with rising channels—a critical juncture determining whether recovery persists or falters again . If buyers maintain dominance here confirming breakouts past compression zones—the next major milestone lies around$80k .
Nevertheless ,confirmation holds greater importance than mere anticipation ;until we see sustained movement beyond those descending trendlines accompanied by follow-through action —this effort should be viewed merely as potential rather than established trend reversal . Still though,this current setup indicates positive momentum shift underway whereby bulls are striving convert prolonged periods characterized lower-highs into more robust upside formations.