
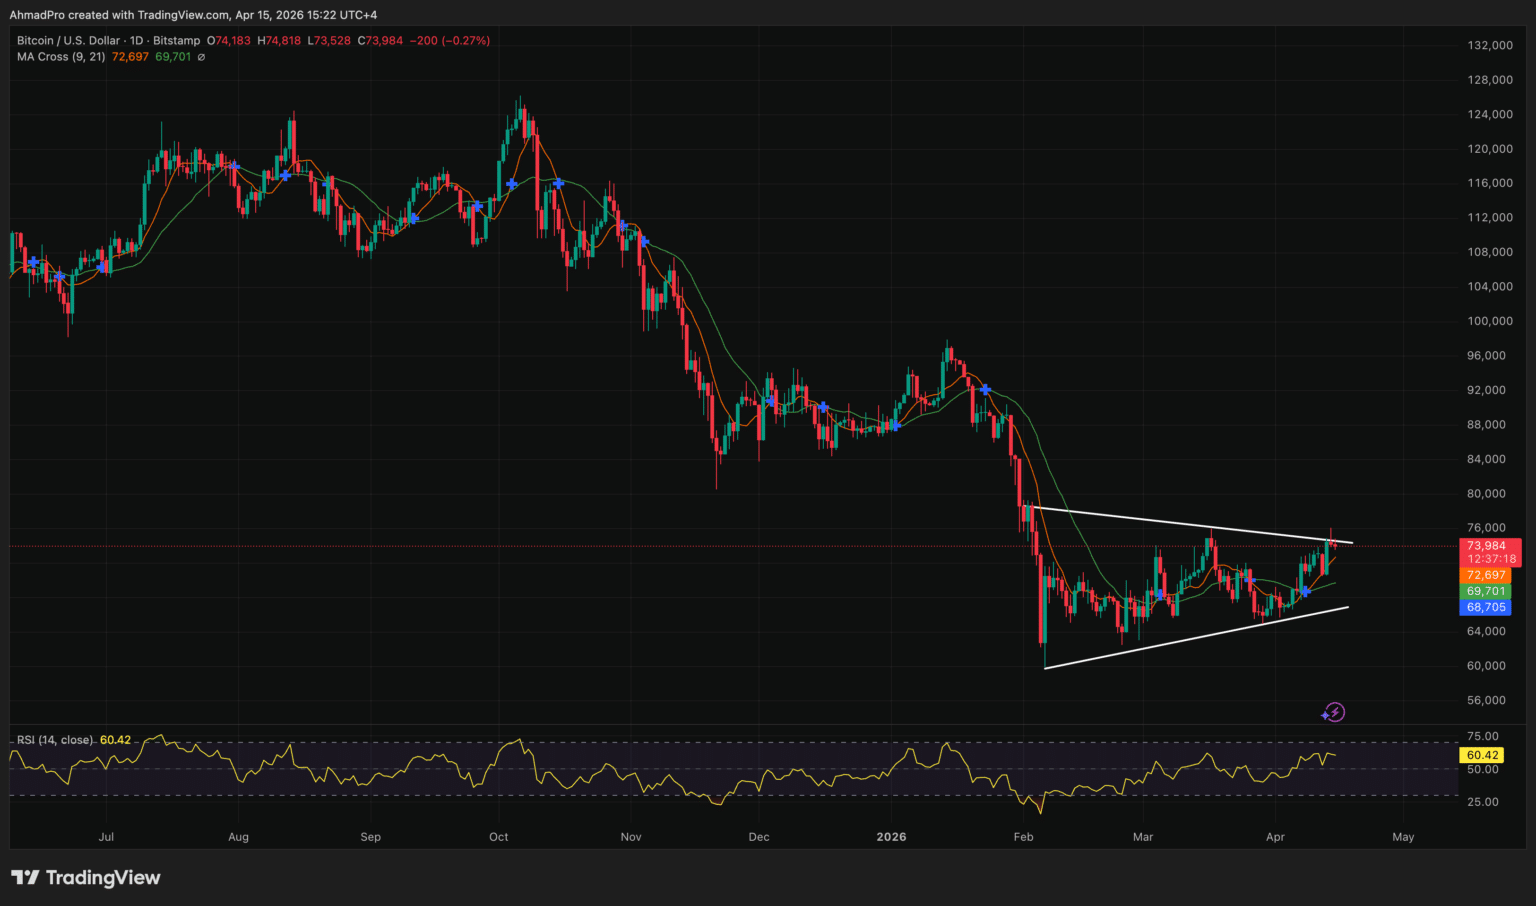
The price of Bitcoin (BTC) is currently trading above $74,000 and has formed an ascending triangle pattern on the daily chart, which technical analysts are interpreting as a bullish signal.
The critical question now is not whether Bitcoin has regained essential support levels; rather, it concerns whether this chart formation provides enough confirmation to aim for the projected target of $90,000. Alternatively, could this breakout merely be a temporary relief rally lacking the necessary on-chain and macroeconomic support for sustained momentum?
Understanding the Ascending Triangle in Bitcoin’s Price Chart
This particular pattern is known as an ascending triangle—characterized by a flat upper resistance line and an upward-sloping lower trendline. This indicates that buyers are consistently defending higher lows while sellers remain concentrated at a fixed resistance level.
In recent developments, Bitcoin consolidated above $73,000 earlier in the week before breaking out past $76,000—a price point not seen since early February 2026.
Source: Tradingview
The fundamental implication of an ascending triangle is clear: it suggests that buying pressure is increasing relative to selling at resistance. A decisive break above this ceiling typically forecasts a measured move equal to the height of the widest part of the triangle.
When applied to our current situation, this measured move points towards approximately $90,000—aligning with previous resistance levels that capped Bitcoin during its late-2025 rally phase. This figure holds significance beyond being just another round number; it represents a former structural ceiling that could shift into support if surpassed.
Historical analysis shows that ascending triangles forming after significant declines often lead to sustained upward movements rather than immediate reversals when they break out above multi-month resistance levels.
A key condition remains: for this breakout to be valid on a daily closing basis must stay above prior resistances—a threshold yet convincingly defended by Bitcoin. Until we see consistent daily closes over $76,000–$80,000 confirmed as stable ground beneath us instead of mere fluctuations in price action—this pattern should be viewed more as developing than confirmed breakout territory.
On-Chain Activity Reinforces Pattern Validity
This technical setup does not exist independently from market dynamics. Data from CryptoQuant reveals that on April 5th 2026; there were approximately 765130 daily transactions recorded—a peak unseen in over seventeen months surpassing activity during previous high-price periods indicating ongoing network engagement rather than speculative behavior confined solely within derivatives markets.
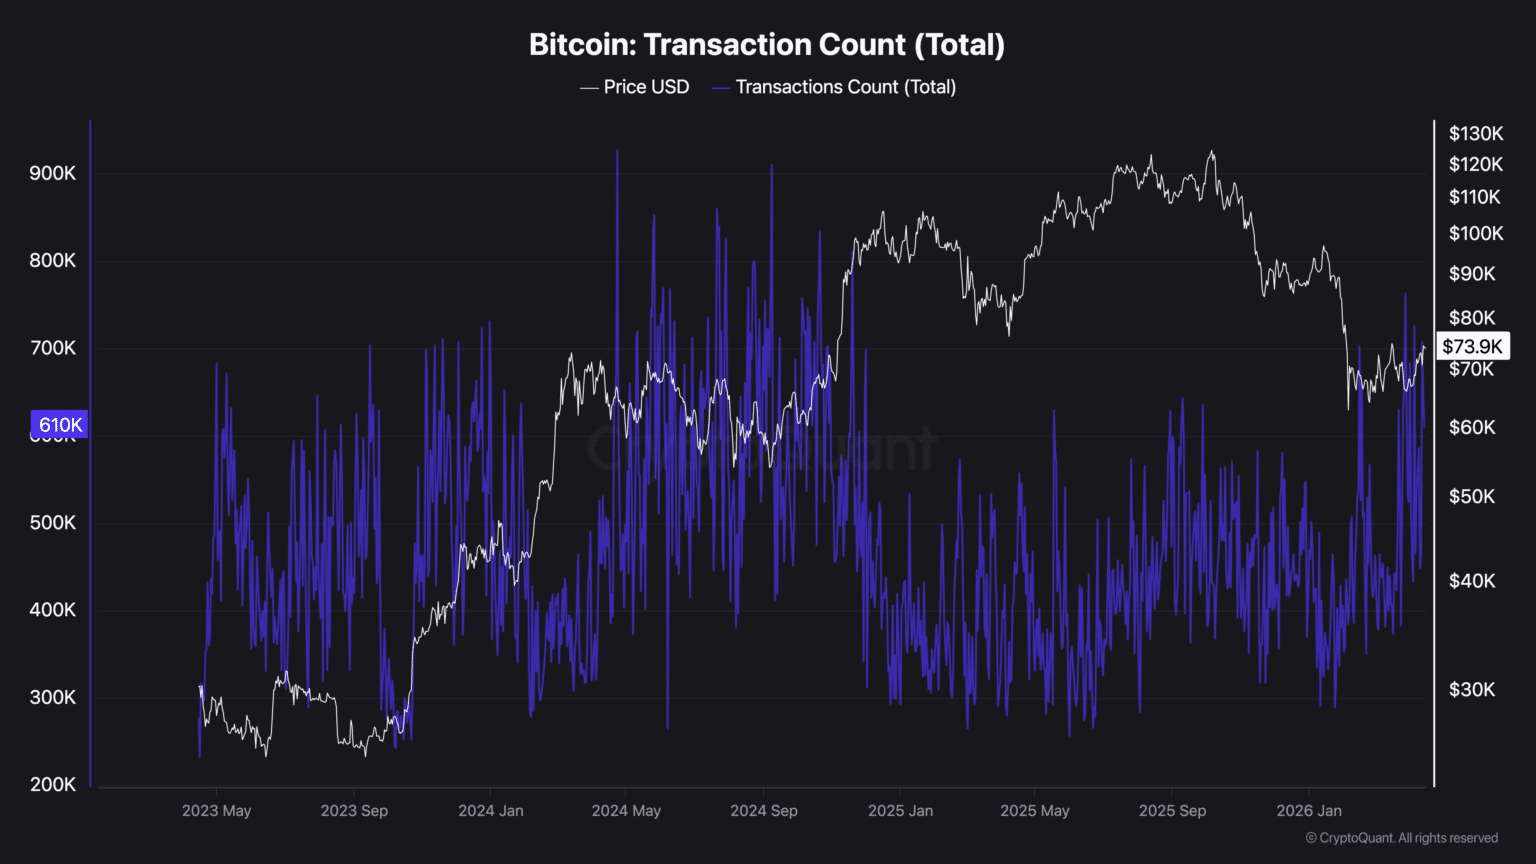
Source: Cryptoquant
Additionally supporting these findings are Glassnode statistics showing total on-chain fee volume rising roughly four percent week-over-week reaching around $153700 correlating with recent price recovery suggesting real economic activities underpinning network activity accompanying market bounce back efforts.
This mechanism plays an important role when assessing validity regarding observed patterns; historical data indicates ascendant triangles breaking out amid low transactional volumes tend toward vulnerability against quick retests while those accompanied by growing transaction counts & fee volumes enjoy stronger structural backing—the current readings indicate fundamentals reinforcing chart signals although they confirm participation without guaranteeing directional movement henceforth.
Divergent institutional forecasts add complexity into interpretation layers surrounding future pricing expectations Standard Chartered recently adjusted its year-end projection downwards from $200k towards $100k citing slower corporate treasury adoption alongside heavier reliance upon ETF inflows nonetheless still positioning (90k target interim milestone instead ceiling.
Bernstein conversely raised their own forecast up-to$150K labeling existing cycle structurally broken compared past four-year patterns due persistent institutional demand shifts For broader context examining how institutional outlooks evolved trajectory illustrated through Standard Chartered’s bitcoin calls showcases rapid consensus changes among institutions involved