$BTC is currently trading at $72,896 as of April 11, maintaining its position within a rising 30-minute channel. Meanwhile, the daily chart remains above three exponential moving averages (EMAs), and spot exchange-traded funds (ETFs) have recorded consecutive inflows totaling $598 million.
$BTC Daily Chart: The Crucial Level Is $74,000
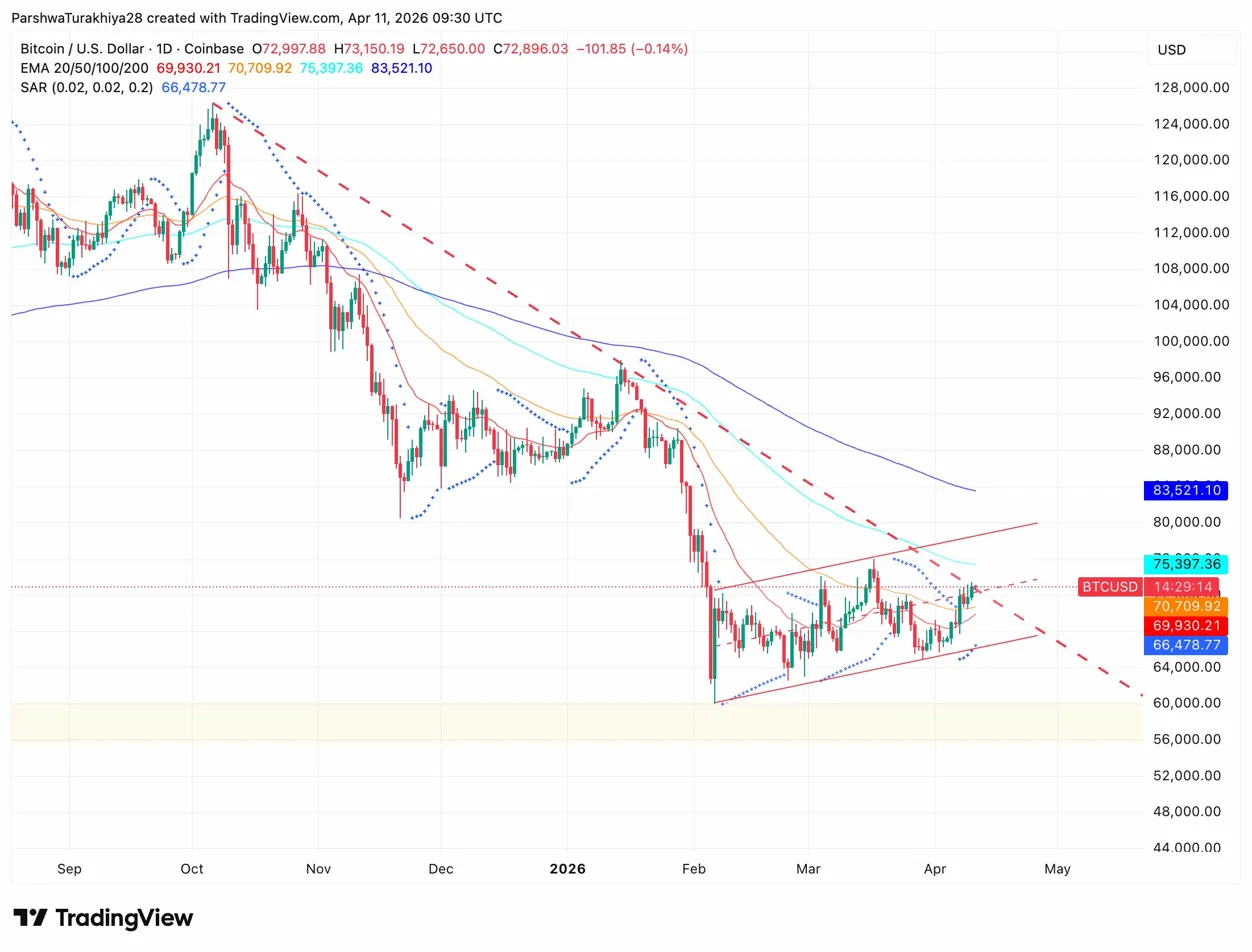
The 20-day EMA is positioned at $69,930 while the 50-day EMA stands at $70,709; both have crossed below the current price and now serve as support levels. Further down lies the SAR indicator at $66,478. On the upside, resistance levels are marked by the 100-day EMA at $75,397 and the 200-day EMA at $83,521.
An ascending wedge pattern has formed since February’s low of around $60,000. The price is approaching its upper boundary near between $73,000 to $74,000—this coincides with a descending channel from October that restricts upward movement. A daily close above this range would signal potential for further gains; however losing ground below the 50-day EMA could bring attention back to support around SAR.
Key Levels for April 12:
- SAR Support: $66,
478 - 20-Day EMA: $69,
930 - 50-Day EMA: $70,
709 - Resistance Zone: $73,
000 to $74, 000 - 100-Day EMA: $75,
397 - 200-Day EMA: $83,
521 - February Low: $60,
000
$BTC 30-Minute Chart Analysis : Rising Channel Remains Intact with Positive MACD Trend

The analysis of a thirty-minute chart reveals a clear upward channel originating from an April 8 low near &$67 ,000 . Each subsequent pullback has remained above previous lows throughout April ninth through eleventh . Currently , prices hover near mid-channel around &$72 ,896 with upper boundaries reaching between &$75 ,00 to &$76 ,00 and lower boundaries situated around &$71 ,500 .
The RSI stands at  ;51.70 just surpassing its signal line which rests on  ;48.78 indicating bullish tendencies without being overextended yet . Meanwhile MACD histogram shows positive momentum reading  ;9.37 although fast line remains beneath zero suggesting momentum build-up lacks full confirmation thus far . Maintaining positions above  ;$71,  ;500 preserves short-term structure intact while dropping below shifts focus back towards daily EMAs.
$ BTC
Inflows into Bitcoin ETFs Totaling Combined Amounts of Two Consecutive Days Worth $  ;598 Million
After experiencing outflows amounting up-to $  ;124 million on both days seventh& eighth respectively followed by reversal leading up-to inflow totals reaching roughly$  ;
358 million then another additional$  ;
240 million subsequently later during tenth day where BlackRock’s IBIT topped it off contributing approximately$  ;
137 million alongside Fidelity’s FBTC adding nearly& dollar;
78million resulting in total net assets resting comfortably upon roughly $
This two-inflow day phenomenon coincided precisely alongside movements observed within
Bitcoin prices shifting upwards transitioning from approximatelyD thousand dollars up until nearing seventy-three thousand confirming institutional investors opted for buying dips rather than chasing rallies instead .
$ BTC
Derivatives Analysis Reveals Shorts Suffering Greater Losses Compared To Long Positions
Volume dropped significantly by twenty-six point zero nine percent falling down towards fifty-one billion dollars whereas open interest increased slightly by four point two five percent reaching fifty-four billion dollars indicating that existing positions remain steady rather than expanding further outwards .
Long-short ratio appears flat standing tall right about one point zero zero two wherein Binance accounts exhibit slight bias leaning more heavily toward shorts showing figures hovering closer toward zero point seven five six five along similar trends reflected across OKX platform showcasing readings closer towards eight-five.
In terms regarding liquidations occurring within past twenty-four hours shorts endured losses summing upwards exceeding forty-two million compared against merely seven-point sixty-five incurred amongst longs whilst options open interest also rose marginally nearing thirty-three billion demonstrating second consecutive day expansion correlating closely amidst ongoing resistance faced throughout markets surrounding Bitcoin pricing activity.
Price Forecast For Bitcoin On April Twelfth
Upside Scenario:
If conditions hold true whereby thirty-minute channels maintain stability remaining firmly positioned beyond seventy-one thousand five hundred along with successful closures exceeding thresholds ranging anywhere between seventy-three-thousand through seventy-four-thousand then next significant targets will lie ahead aimed directly toward hitting hundred-days exponential moving average located precisely upon seventy-five thousand three hundred ninety-seven reflecting ongoing strength found amidst ETF inflows consistently surpassing beyond two-hundred-million each passing day ensuring continued institutional demand persists unabatedly.
Downside Risks:
Conversely should channels break beneath critical threshold marking below level set forth previously indicated earlier under-seventy-one-thousand five-hundred plus loss incurred regarding fifty-days exponential average would trigger bearish sentiment potentially pushing prices downward targeting SAR placed nearer sixty-six-thousand four-hundred seventy-eight ultimately opening doors leading back down towards february lows resting comfortably nearby sixty-grand mark .
358 million then another additional$  ;
240 million subsequently later during tenth day where BlackRock’s IBIT topped it off contributing approximately$  ;
137 million alongside Fidelity’s FBTC adding nearly& dollar;
78million resulting in total net assets resting comfortably upon roughly $
Bitcoin prices shifting upwards transitioning from approximatelyD thousand dollars up until nearing seventy-three thousand confirming institutional investors opted for buying dips rather than chasing rallies instead .
Derivatives Analysis Reveals Shorts Suffering Greater Losses Compared To Long Positions
Volume dropped significantly by twenty-six point zero nine percent falling down towards fifty-one billion dollars whereas open interest increased slightly by four point two five percent reaching fifty-four billion dollars indicating that existing positions remain steady rather than expanding further outwards .
Long-short ratio appears flat standing tall right about one point zero zero two wherein Binance accounts exhibit slight bias leaning more heavily toward shorts showing figures hovering closer toward zero point seven five six five along similar trends reflected across OKX platform showcasing readings closer towards eight-five.
In terms regarding liquidations occurring within past twenty-four hours shorts endured losses summing upwards exceeding forty-two million compared against merely seven-point sixty-five incurred amongst longs whilst options open interest also rose marginally nearing thirty-three billion demonstrating second consecutive day expansion correlating closely amidst ongoing resistance faced throughout markets surrounding Bitcoin pricing activity.
Price Forecast For Bitcoin On April Twelfth
Upside Scenario:
If conditions hold true whereby thirty-minute channels maintain stability remaining firmly positioned beyond seventy-one thousand five hundred along with successful closures exceeding thresholds ranging anywhere between seventy-three-thousand through seventy-four-thousand then next significant targets will lie ahead aimed directly toward hitting hundred-days exponential moving average located precisely upon seventy-five thousand three hundred ninety-seven reflecting ongoing strength found amidst ETF inflows consistently surpassing beyond two-hundred-million each passing day ensuring continued institutional demand persists unabatedly.
Downside Risks:
Conversely should channels break beneath critical threshold marking below level set forth previously indicated earlier under-seventy-one-thousand five-hundred plus loss incurred regarding fifty-days exponential average would trigger bearish sentiment potentially pushing prices downward targeting SAR placed nearer sixty-six-thousand four-hundred seventy-eight ultimately opening doors leading back down towards february lows resting comfortably nearby sixty-grand mark .