The leading cryptocurrency, Bitcoin, has seen a rise of 1.84% during the U.S. market hours on Friday, currently trading at $73,106. This increase is attributed to a general relief rally as the lack of new geopolitical tensions has maintained a delicate peace between the U.S., Iran, and Israel. However, on-chain analytics reveal two significant resistance levels that could hinder Bitcoin’s price from stabilizing and initiating a recovery trend.
$BTC Approaches $73K as ETF Break-Even Point Limits Growth
Bitcoin is hovering around $73,000—only $3,700 below the average value accumulated by major U.S. spot ETFs for $BTC. Any short-term price increases may present selling opportunities for those who entered at higher prices and are currently facing losses.
Short-term holders have an average cost basis of $84,200; this exposes them to significant unrealized losses in today’s market conditions. In contrast, long-term holders possess approximately 42,500 BTC and show less urgency to sell their assets.
The net asset weighted average cost for U.S. ETFs stands at $76,700—this is the threshold where these institutional investors transition from incurring losses to breaking even on their investments.
This situation creates two distinct layers in supply dynamics: short-term resistance exists at $76,700—the ETF cost level—and breaking above this point would alleviate selling pressure once these funds reach neutral territory. Remaining below this level would continue to encourage distribution from institutional holdings.
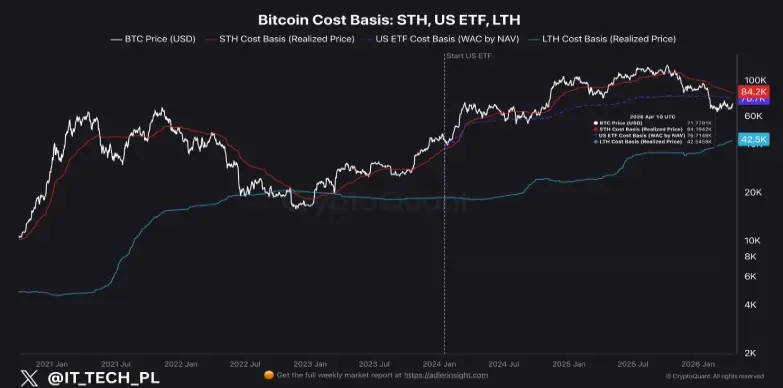
The heightened resistance level at $84,200 due to new buyer entries remains secondary; long-term holders exert minimal influence over selling in extended timeframes.
Bitcoin Price Attempts Bullish Breakout From Six-Month Channel Pattern
Over the past fortnight, Bitcoin’s price has demonstrated a gradual recovery from its low of $65,000 up to its current value of around $73 193—a decrease of 13%. This upward movement coincides with an increase in trading volume as market sentiment improved following a two-week ceasefire announcement.
The recent uptick challenges the downward-sloping resistance trendline within a falling channel pattern visible on daily charts since early October 2025; during this period,$BTC‘s price has consistently interacted with two parallel trendlines that provide dynamic support and resistance levels.
A successful breakout beyond this resistance could indicate a significant shift in market sentiment while driving prices toward further recovery efforts. The recently reclaimed slopes of both the 20-day and 50-day EMA offer additional backing for recovering $BTC.
If there’s indeed an upward breakout rally post-resistance breach it might propel Bitcoin by about 15%, challenging levels near $84 ,500 before potentially reaching up towards$98 ,300 .
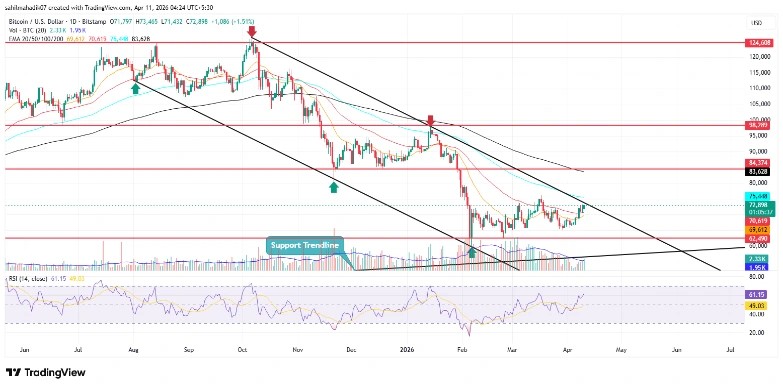
If however ,the channel’s upper boundary holds strong against incoming pressure while maintaining consistent supply influxes upon BTC ,we may witness declines downwards towards immediate support around$62 ,720 .This reversal could initiate another correction cycle within our existing channel framework .