Bitcoin is once again challenging significant resistance, yet the road ahead appears congested. A daily chart indicates that $BTC is testing the upper limit of its current range, while short-term order book data reveals substantial selling pressure just above its present price.
Bitcoin Approaches Final Range Resistance as Third Breakout Attempt Commences
Bitcoin is making another attempt to reach the peak of its broader trading range, and this chart illustrates why traders are closely monitoring this movement. According to Titan of Crypto, $BTC has successfully navigated through the second fair value gap (FVG), leaving only one imbalance overhead. This positions Bitcoin near the last resistance area before a potential breakout from its current range.
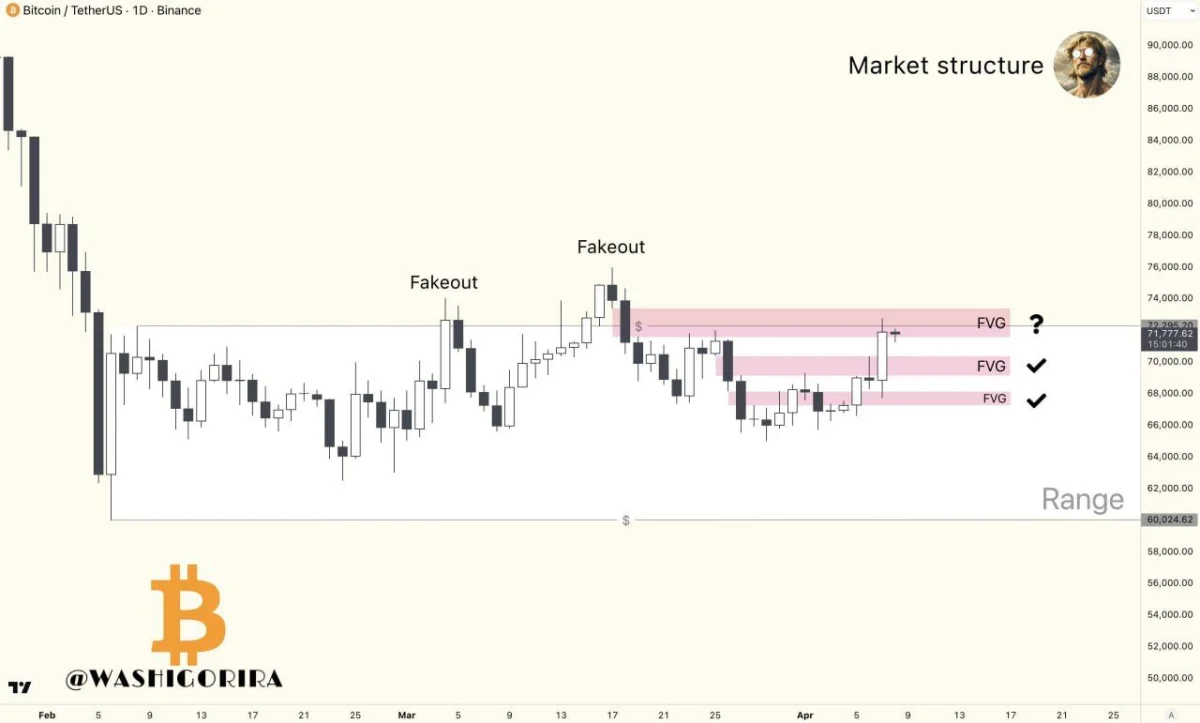
The Daily Chart for Bitcoin. Source: Titan of Crypto on X
The chart depicts Bitcoin operating within a large sideways structure following a steep decline. Since then, it has repeatedly struggled to maintain levels above the upper boundary. Previous attempts at breaking out resulted in false breakouts; buyers managed to push prices beyond resistance but could not sustain control afterward. Consequently, $BTC fell back into its previous trading range each time.
This time around, however, things appear different. The price has gradually reclaimed lower FVGs and is now advancing towards the final overhead FVG close to the top of this range—an important development indicating stronger recovery compared to past attempts. Rather than facing immediate rejection like before, Bitcoin has moved through several imbalance zones and maintained upward momentum.
Nevertheless, there’s still no confirmation of a breakout on this chart just yet; that upper FVG continues acting as resistance in an area where earlier false breakouts occurred previously—making it crucial for traders to keep an eye on this level moving forward. Should Bitcoin manage to surpass that final FVG and close above the high end of its current range effectively shifts market dynamics more favorably toward buyers.
If instead $BTC fails at this critical juncture again—the established trading range will remain intact—leading analysts to view any further movements as mere rejections from resistance rather than signs pointing toward sustained bullish activity with potential price rotations back towards mid or lower ranges likely occurring thereafter.
The main takeaway here remains evident: while Bitcoin’s position improves after clearing two overhead FVGs—the ultimate test still lies ahead! This third attempt may lead us closer toward genuine breakout conditions—but confirmation above our defined ceiling must occur first!
A Pause in Momentum After Sharp Ascendancy Amidst Whale Orderbook Indicating Heavy Sell Wall
A pause follows after recent gains made by Bitcoin during its latest upward movement—and insights from CoinGlass whale orderbook snapshots clarify some reasons behind it all! The 15-minute timeframe reveals considerable sell pressure accumulating between $72,400 and $73,600—with significant bids visible much lower around $70 ,600 boasting over $40 million worth backing them up!
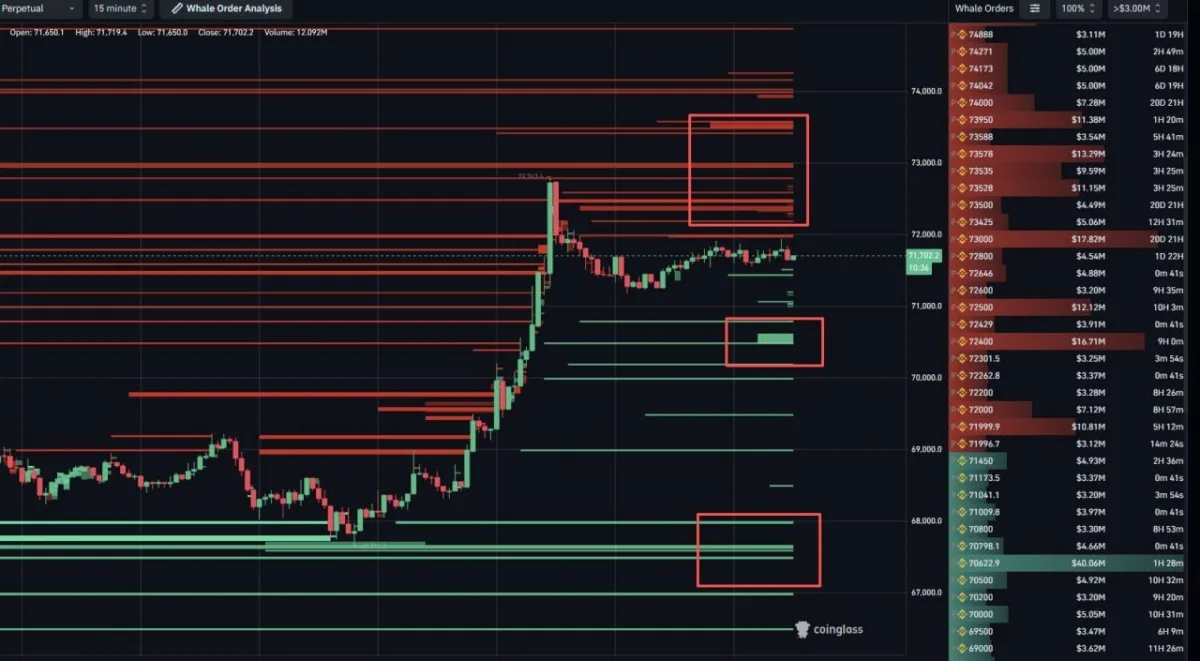
An Analysis Of The Whale Orderbook For BTC Over A 15-Minute Interval Source: CoinGlass On X
The provided graph shows how$ BTC trades roughly around$71 ,700 following rapid ascension .Since then ,prices have begun moving sideways instead extending higher suggesting consolidation taking place among traders reacting against thick clusters formed by sell orders looming overhead .
The clearest zone indicating strong resistance rests firmly between$72 ,400and$73 ,600with multiple sizable red blocks stacked therein implying sellers poised right above present pricing levels.As long these orders persist,Bitcoin might face challenges breaking upwards anytime soon—even if prices surge higher,this particular region could impede progress or trigger fresh rejections altogether!
Conversely,the most prominent visible support identified within snapshot lies nearby at approximately$70 ,600.CoinGlass marks said threshold representing largest bid recorded thus far exceeding forty million dollars making vital point worth monitoring should pullbacks commence.If sellers drive downwards,buyers may seek defense strategies surrounding said zone initially !
Additionally,the chart highlights smaller bids existing atop aforementioned levels including support zones hovering around low seventy thousands approaching seventy four hundred mark.So presently,Bitcoin seems trapped amid proximity supports juxtaposed against dense walls formed via supply structures.In simpler terms,the marketplace transitioned away from expansion phases into more stable ranges !
Consequently,traders are observing both extremes throughout established framework.A breach surpassing heavy selling pressures ranging across seventy-two thousand four hundred-seventy-three thousand six hundred could reignite bullish sentiment once again.On contrary side though if $ BTC’s losses extend beneath prevailing supports,a larger liquidity magnet potentially awaits below near seventy thousand six hundred mark.Currently,data suggests ongoing dominance resides firmly rooted within established short-term setups revolving primarily about tight-ranging trades!