The leading cryptocurrency, Bitcoin, has experienced a decline of approximately 1% during U.S. trading hours, currently priced at $68,202. This downturn is largely attributed to escalating geopolitical tensions in the Middle East, particularly following an ultimatum issued by the U.S. government to Iran regarding the reopening of the Strait of Hormuz. Additionally, on-chain metrics reveal that market sentiment has plunged into extremely bearish territory—a trend that historically precedes significant price bottoms for $BTC. The pressing question remains: will Bitcoin maintain its position above $60,000?
$BTC Network Activity Hits Record Lows as RVTS Ratio Peaks
The Bitcoin Sentiment Index has fallen to some of its most negative levels seen in recent times. This metric monitors long-term sentiment trends and reflects underlying market positions that may be obscured by short-term price fluctuations.
Such low readings have frequently been observed during periods when retail investors are exhausted. Pessimistic narratives proliferate as liquidity diminishes after severe drawdowns; meanwhile, larger players begin hoarding coins without any prior indication.
This scenario aligns with classic technical patterns: final selling climaxes followed by misleading spring moves and terminal shakeouts that eliminate remaining weak hands from the market. Historical data suggests these conditions do not typically signal major trend breakdowns but rather mark exhaustion points where persistent selling pressure starts to ease.
While there are still limited potential downsides ahead, they appear less severe than previous declines. A sharp drop of around $15,000 cannot be ruled out entirely—this could trigger a final wave of panic across the market.
In the coming weeks, this negative sentiment is likely to persist; prices may fluctuate within a narrow range or drift slightly lower—creating an impression that Bitcoin is increasingly overlooked and abandoned.
This phase could extend over five months characterized by diminishing public interest and apparent disengagement from active participation in trading activities while long-term accumulation quietly occurs behind the scenes.
$BTC Indicates Retail Exhaustion as Bearish Index Reaches Extremes
Over the past 48 hours, Bitcoin’s price faced a significant rejection at around $70,350 before dropping 2.8%, now trading at approximately $68,382. This pullback was primarily influenced by rising tensions in the Middle East after Iran dismissed calls for a ceasefire with the U.S., compounded by Donald Trump’s alarming remarks suggesting dire consequences ahead for civilization itself.
If geopolitical unrest continues unabated,$BTC‘s value might plummet another 8.7% towards immediate support levels near $62,450 followed closely by potential drops to around $57,000. Despite this downward movement however; Bitcoin’s pricing remains confined within a falling channel pattern on daily charts since October 2025—oscillating between two parallel trendlines acting as dynamic resistance and support zones respectively.
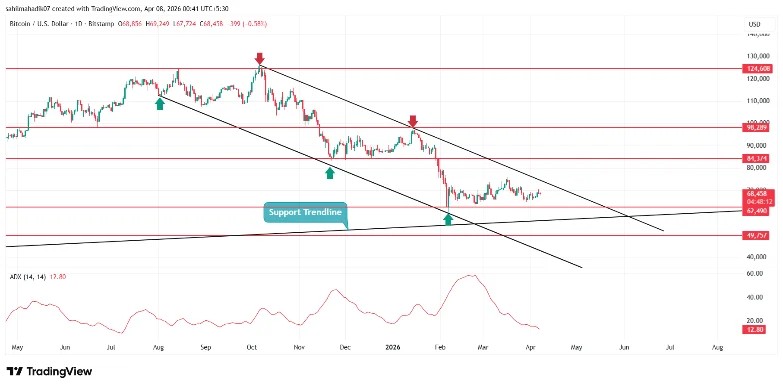
A bullish breakout above this pattern’s resistance line near $70k will be essential for buyers seeking relief from current corrective trends.