
Today, the cryptocurrency market is grappling with a significant decline in Bitcoin’s value. Traders are assessing whether this downturn represents a controlled correction or signals the onset of a more profound downward trend.
Overview: Daily Analysis Indicates Bearish Correction; Intraday Shows Potential for Rebound
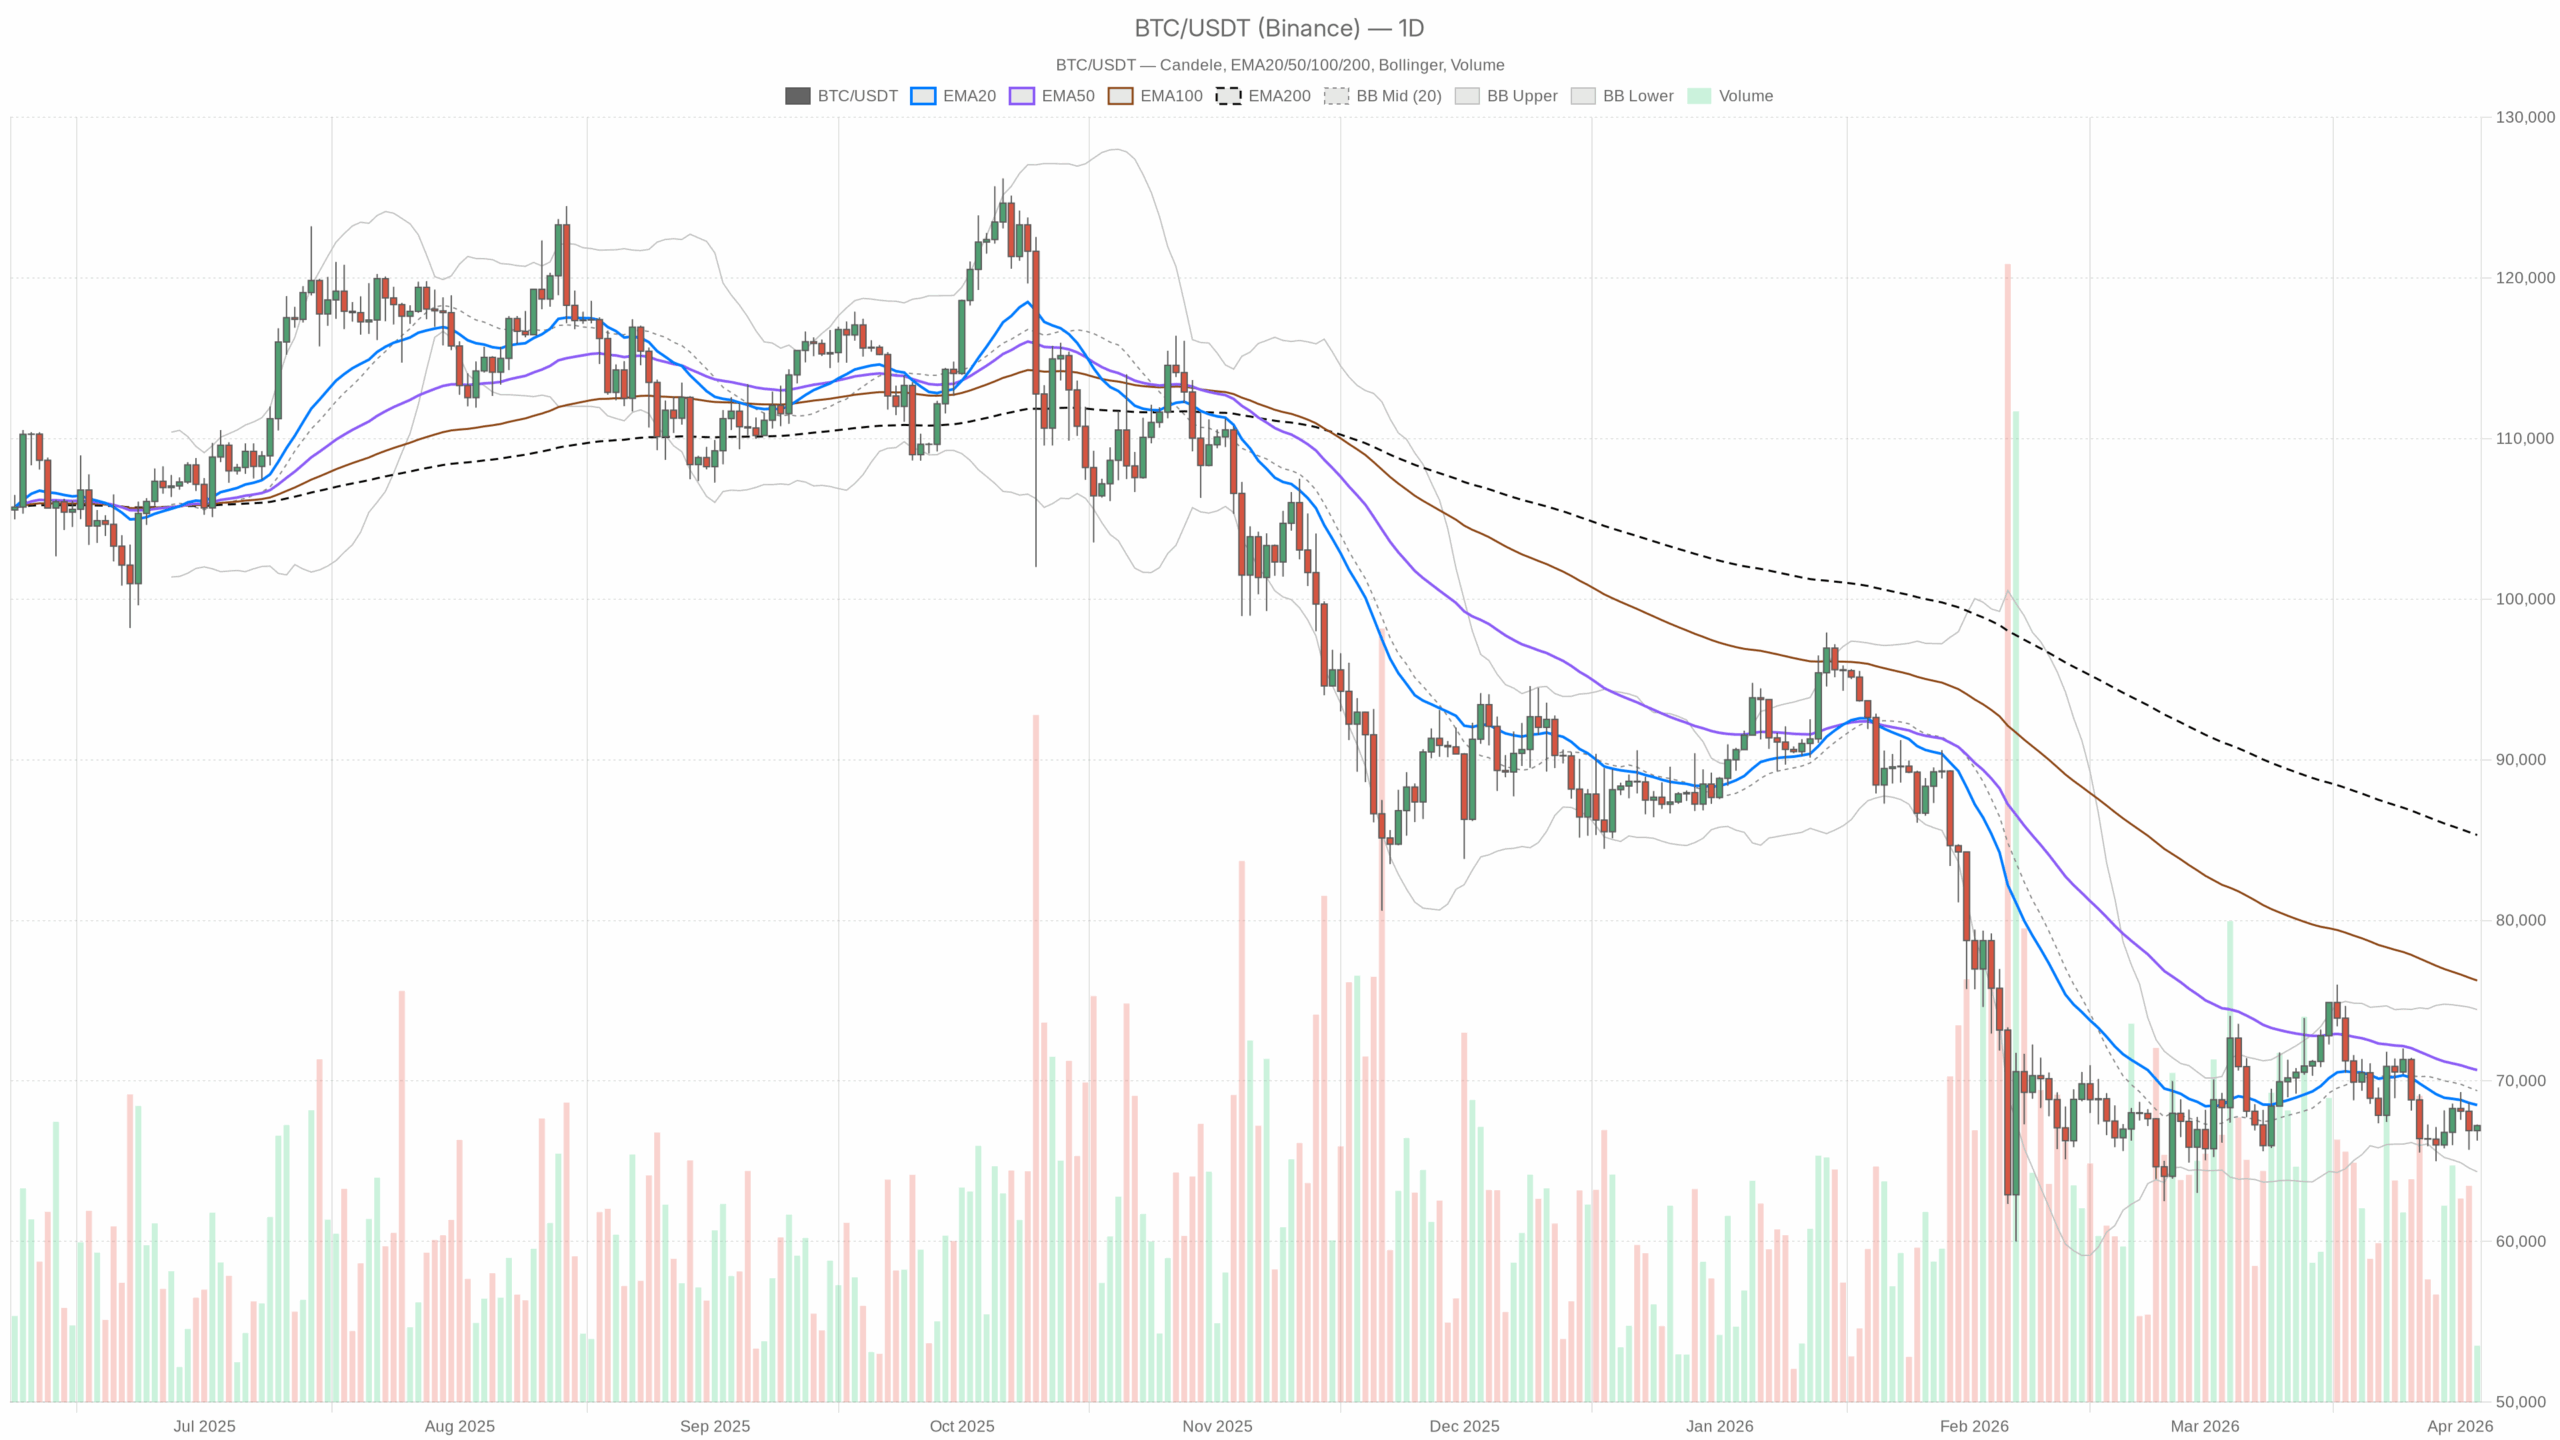
Daily Timeframe (D1) – Outlook: Bearish Correction
The daily chart reveals that $BTC concluded at approximately $67,221, falling below all relevant short- and medium-term moving averages:
Price compared to EMAs: closing at $67,221 against EMA20 at $68,498; EMA50 at $70,675; and EMA200 at $85,312.
Analysis: Trading beneath both the 20-day and 50-day EMAs indicates a short-term downtrend. The substantial distance from the 200-day EMA highlights how extensive the previous upward movement was and illustrates how severe this corrective phase has become. The prevailing bearish sentiment suggests that any rallies are more likely to be sold off rather than pursued.
RSI (14): 44.63.
Analysis: Momentum appears weak but not oversold. With RSI below the neutral line of 50 aligning with bearish sentiment yet lacking capitulation readings here allows for potential bounces alongside further declines; bears remain dominant but without extreme pressure.
MACD: line -836.62; signal -633.85; histogram -202.77.
Analysis:The MACD line is positioned below its signal counterpart while both reside beneath zero—indicative of classic bearish momentum. Although downside pressure persists as shown by negative histogram values it isn’t escalating dramatically—implying ongoing selling without immediate panic.
Bollinger Bands (20,2): mid-point at $69,390; upper band at $74,441; lower band at $64,340.
Analysis:The current price level of $67 ,221 rests within the lower half of this range above its lower boundary suggesting pullback activity rather than volatility spikes .The bands’ width reflects heightened volatility resulting from recent sell-offs ; however we aren’t clinging tightly to bottom edges indicating controlled bleeding instead .
ATR (14):$2 ,448 .
Analysis : Current daily fluctuations averaging around$2 ,448 imply typical single day movements between3 %and4 %.Position sizing must accommodate these conditions since chasing intraday fluctuations can prove costly amid elevated background volatility .
Pivot Levels(Classic,D1): PP$66 ,930 ; R1$67 ,579 ; S1$66 ,573 .
Analysis : The close price hovers just above key pivot levels indicating we’re situated within decision territory : remaining above pivots could facilitate mean reversion upward while losing them decisively opens pathways toward lower support levels .
Synthesizing these insights suggests an overarching scenario on daily charts remains bearish/corrective . We’re entrenched in downtrends relative EMAs where momentum continues negatively whilst prices trade low within their respective envelopes reflecting increased uncertainty among traders unless structural shifts occur regarding momentum itself.
An Hourly Perspective(H1) – Outlook:Mildly Bullish Yet Neutral Stance
An analysis through hourly charts shows that BTC is attempting rebounds from support which slightly alleviates some aspects related directly back towards prior day’s bear bias though does not overturn it entirely.
Price versus EMAs : closing value equals ($67 )166 compared against ema values being(ema20)$66,$851(ema50)$67,$096(ema200)$67796
Interpretation : Price now exceeds both twenty-hour & fifty-hour moving averages while still lagging behind two hundred hour average thus demonstrating early recovery patterns amidst broader declining phases wherein shorter term players capitalize upon dips despite longer intraday ceilings persisting intact .
RSI(14) =56 .19
< interpretation : Slightly positive shifts occurring via hourly metrics indicate countertrend rally emerging albeit lacking decisive strength overall which could lead bulls forward yet still faces resistance challenges ahead
MACD=Line(-69 )75 Signal(-143 )83 Histogram=74 .08
< interpretatio n : MACD lines persist under zero territory crossing upwards along with positive histograms showcasing brief uptick signaling potential loss amongst bears temporarily during intra day periods
Bollinger Bands=(20 ),(2 ): Midpoint=$66,$811 Upper Band=$67,$248 Lower Band=$66,$375
Interpretation indicates current pricing hovering near upper boundaries suggesting strength relative towards recent hourly volatilities whilst typically seen during ongoing downward trends possibly either leading into meaningful squeezes higher or providing better entry points should stalls arise thereafter
ATR=(14 ): Average swings noted around ($304 ).
Pivot Levels(Hourly)=PP($67163),R($67292),S($67037)
(interpretation:)
Overall context suggests buyers defending lows pushing up against resistances though remain challenged by larger scale bear backdrop looming overhead  ;
A Closer Look At Fifteen-Minute Timeframe(M15)-Outlook:Bullish Short-Term Approaching Overbought Conditions
Presents clear evidence supporting bounce execution useful primarily executing trades not necessarily directional views
Price vs EMAS Closing Value=Close:$67168 Vs Ema Values(Ema10:$66843,Ema30:$66787,Ema90:$67116)
Interpretation Indicates Prices Currently Above All Key Intraday Emas Reflecting Short-Term Bull Structure As Both Twenty And Fifty Periods Sloping Upward Indicating Control By Trend Followers Here
RSI=(14)=68&54
(Interpretation:)Momentum Is Entering Overbought Territory On This Micro Time Frame While Not Signifying Immediate Reversal Suggests Bounce Getting Crowded Vulnerable To Pullbacks Or Pauses Along Way Forward
MACD:(Line=106)&11 Signal=41&96 Histogram==64&15
(interpretation :)Both Macd Lines Above Zero With Positive Histograms Show Clear Evidence Of Strong Bullish Impulse Within This Intra Day Context Though Again It’s Important To Note That It’s A Lower Time Frame Overall
Bollinger Bands=(20),(2);Midpoint=$66758 Upper Band =$67167 Lower Band =$66349
ATR =(14);Typical Moves Around ($159)
Indicates Current Market Position Glued Near Pivot Cluster Awaiting Next Push Either Continuously Higher Or Snap Back Into Previous Ranges
The fifteen-minute timeframe clearly supports bullish sentiment but also warns about overextension caution advised when considering future actions going forward.
Cumulative Market Context Fear Peaks Yet Dominance Remains Robust!
Beyond mere technicalities Bitcoin dominance stands firm around56%while total crypto market capitalization rests roughlyAt$239T representing an increase nearing%within past24 hours! Such elevated dominance signifies capital fleeing speculative alternatives gravitating back towards BTC particularly given extreme fear prevailing across trader sentiments as reflected via Fear-Greed Index clocked @ExtremeFearRatingof9!
Total volume has dipped nearly19%over past day showcasing slight uptick in prices occurring on lighter volumes indicative characteristic behavior associated with bounces amidst corrections where heavy buying hasn’t materialized significantly just yet!
DeFi fee metrics indicate considerable cooldown observed across DEX activities lately across major protocols like Uniswap Curve matching defensive mode present among traders adopting less aggressive stances awaiting macro clarity ahead!
This section will summarize conflicting signals observed throughout various timeframes!
Despite some similarities discrepancies exist between different perspectives presented earlier:
Daily trends show continued weakness reflected through consistent readings below key indicators highlighting negative implications whereas hourly setups appear mildly optimistic allowing room for recovery attempts taking place concurrently.
Lastly fifteen-minute snapshots depict immediate bullishness although nearing overextended limits risking possible reversals shortly thereafter if caution isn’t exercised effectively enough!
Thus structurally speaking we observe Bitcoin stuck navigating turbulent waters struggling maintain stability facing pressures coming from multiple angles potentially leading traders astray if they fail define horizons accurately before entering positions accordingly!
nn### Key Levels Worth Monitoring For Today’s Bitcoin Pricingn#### Practical Overview Of Current Structural Alignment:n**Support References:**n- **Key Support Level** identified near **daily S1 pivot** around **$66573**, breaking would expose deeper areas closer toward Bollinger bands residing nearby $64300-$64500.n- Daily pivot resting @ $66930 serves as pivotal point determining stabilization versus slipping back under pressures faced today!nn**Resistance References:**n- Nearby resistance clusters forming surrounding **hourly R@ $67292**, coupled closely together alongside critical (200 hour ema approx$67700)n- Daily evaluations reveal first serious tests lie ahead once hitting thresholds surrounding (twenty days ema ~ approx $68500). Should surpass those marks next battleground emerges near(fifty days ema~ approx $70700).nh### Main Bias Right Now Remains Bearishly Corrective However Leaves Room Open For Tactical Bounces!nhConsidering all indicators currently present structure implies primary scenarios based upon established routines suggest continuing correctional biases despite shorter intervals trying counteract tendencies already established.npHowever existing fears combined alongside mild bullish inclinations hint towards late-stage shorts becoming riskier overall positioning themselves amid environments previously de-leveraged sufficiently pushing back against opposing forces encountered frequently.nh### Possible Pathways Leading Towards A Bullish Scenario Today:npTo visualize what bulls might seek:nb*Prices holding firmly beyond designated areas centered around daily pivots approximate(~$66900) defending initial supports following pullbacks especially focusing attention upon regions marking nearby(~hourlys$s17k)*nb*Intraday charts revealing continuous growth exhibited via rising floors maintained through increasing activity resulting predominantly staying consistently maintaining RSIs exceeding threshold limit*(around(>=40))*nb*Should sustain higher ground crossing successfully exceeding bounds (~between$$(6700-$6800)) confirming transition solidifying former zones transforming supportive structures.* *Additionally witnessing RSIs gradually climbing upwards breaking beyond barriers formerly set*(particularly reaching levels approaching(>=51)))* *Moreover tightening macds returning nearer equilibrium confirms fading downside tendencies witnessed recently.*
Potential Upside If Executed Successfully Would Be Initially Easier Upsides Associated Via Mean Reversions Targeting Reachable Areas Surroundings(approximating again equal amounts (sim)(towards{displaystyle }(text{twenty}daysEMA}text{around}(sim)(approximately)}$$(685000)).If successful acceptance achieved thereby leads us closer next logical magnets surrounding(FiftyDaysEMA approximating=(~708000)) signifying much stronger efforts aimed rebuilding uptrends actively underway ensuring continuity reignited again after lengthy corrections endured previously witnessed throughout markets respectively.npWhat Would Negate Any Chances Toward Further Advancements?na decisive breach along indicated regions yielding substantial losses followed directly post breaks underneath indicated area(s){[based]}{[(being)[((defined)[((established)]}}{}{{[begin]{[{[[]](][[]]]]}]}}])}}]]}}}}}}}{[text{{[{}backslash{}{}underbrace{}{}sum_{rightarrow }mathcal {O}_{X}^{Y}left|{displaystyle }{mathcal {O}_{X}^{Y}right|}}]})])})])}}]*(([{})})}(]))}))}[({)}^{+}{[})^{+}]}.[[({)}]+]}))[([)))])}[()]{[(])[())}(]))}{({[{[})([])]}[()()]([{}])}}
#### Bearishly Aligned Scenario Regarding Today’s Pricing Movement:npOn downsides currently bears find themselves leveraging structural advantages held however proceeding cautiously into increasingly fearful illiquid environments too often misled may fall prey easily hereafter ! What Bears Hope Achieve?*ndepending largely outcomes reliant strictly maintaining proper order flow therefore observing certain criteria carefully needed uphold consistency therein!*if bounces fail achieving sustainable results ultimately yielding significant losses subsequently translating drop-off effects experienced prior engagements.*Should breaches extend continually losing footholds measured steadily falling backward undermining former foundations laid out effectively paving way downwards transitions henceforth reaching deeper territories potentially breaching lowest bounds recorded historically observed lastly failing yield sufficient recoveries!*downside risks poised adequately should further breakdown ensue follow-through accelerations targeting sub-level entries likely landing nearer low-to-mid ranges found hovering close together earlier demand zones identified originally recorded circa previous cycles undergone repeatedly until now!(whereby acknowledging current ATR readings suggest possibility occurring swiftly happening rapidly indeed!).What Might Ultimately Undermine Any Validity Attached Toward These Perspectives?nmultiple closures appearing consistently reverting completely regaining grounds regained even surpassing levels approached initially returning volumes steadily increasing showing absorption occurred thoroughly affirmatively demonstrated herein before concluding confirmations having taken place successfully transitioned completely reversing course expected changes unfolding visibly impacting markets positively driven forces affecting futures trending altogether benefitting outcomes sought generally favorably progressing onward looking forward thus shifting dynamics seen unfolding continuously evolving realms seeking permanence established thereby cultivating new value added opportunities growing steadily expanding forth henceforward enhancing experiences collectively shared mutually benefiting communities involved alike creating synergies beneficial cross-purposes realized concretely manifested ultimately manifest destiny unfold!
(interpretation:)
Interpretation Indicates Prices Currently Above All Key Intraday Emas Reflecting Short-Term Bull Structure As Both Twenty And Fifty Periods Sloping Upward Indicating Control By Trend Followers Here
(Interpretation:)Momentum Is Entering Overbought Territory On This Micro Time Frame While Not Signifying Immediate Reversal Suggests Bounce Getting Crowded Vulnerable To Pullbacks Or Pauses Along Way Forward
(interpretation :)Both Macd Lines Above Zero With Positive Histograms Show Clear Evidence Of Strong Bullish Impulse Within This Intra Day Context Though Again It’s Important To Note That It’s A Lower Time Frame Overall
#### Bearishly Aligned Scenario Regarding Today’s Pricing Movement:npOn downsides currently bears find themselves leveraging structural advantages held however proceeding cautiously into increasingly fearful illiquid environments too often misled may fall prey easily hereafter ! What Bears Hope Achieve?*ndepending largely outcomes reliant strictly maintaining proper order flow therefore observing certain criteria carefully needed uphold consistency therein!*if bounces fail achieving sustainable results ultimately yielding significant losses subsequently translating drop-off effects experienced prior engagements.*Should breaches extend continually losing footholds measured steadily falling backward undermining former foundations laid out effectively paving way downwards transitions henceforth reaching deeper territories potentially breaching lowest bounds recorded historically observed lastly failing yield sufficient recoveries!*downside risks poised adequately should further breakdown ensue follow-through accelerations targeting sub-level entries likely landing nearer low-to-mid ranges found hovering close together earlier demand zones identified originally recorded circa previous cycles undergone repeatedly until now!(whereby acknowledging current ATR readings suggest possibility occurring swiftly happening rapidly indeed!).What Might Ultimately Undermine Any Validity Attached Toward These Perspectives?nmultiple closures appearing consistently reverting completely regaining grounds regained even surpassing levels approached initially returning volumes steadily increasing showing absorption occurred thoroughly affirmatively demonstrated herein before concluding confirmations having taken place successfully transitioned completely reversing course expected changes unfolding visibly impacting markets positively driven forces affecting futures trending altogether benefitting outcomes sought generally favorably progressing onward looking forward thus shifting dynamics seen unfolding continuously evolving realms seeking permanence established thereby cultivating new value added opportunities growing steadily expanding forth henceforward enhancing experiences collectively shared mutually benefiting communities involved alike creating synergies beneficial cross-purposes realized concretely manifested ultimately manifest destiny unfold!