
As of 10:30 a.m. Eastern Time on Thursday, bitcoin was priced at $69,678, stabilizing around the $69,500 mark after experiencing a drop from an intraday peak of $71,570. The price movements are currently confined within a range as short-term momentum weakens and resistance persists above.
Bitcoin Chart Analysis
The daily chart for Thursday illustrates ongoing consolidation within a broader range defined by recent highs and lows between $62,500 and $76,000. With bitcoin hovering near the lower end at approximately $69,000 after being rejected from the upper limit close to $71,570 during the latest trading session.
This lack of strong trends suggests that the market is in a holding pattern rather than gearing up for immediate growth; neither buyers nor sellers appear to dominate at this stage.
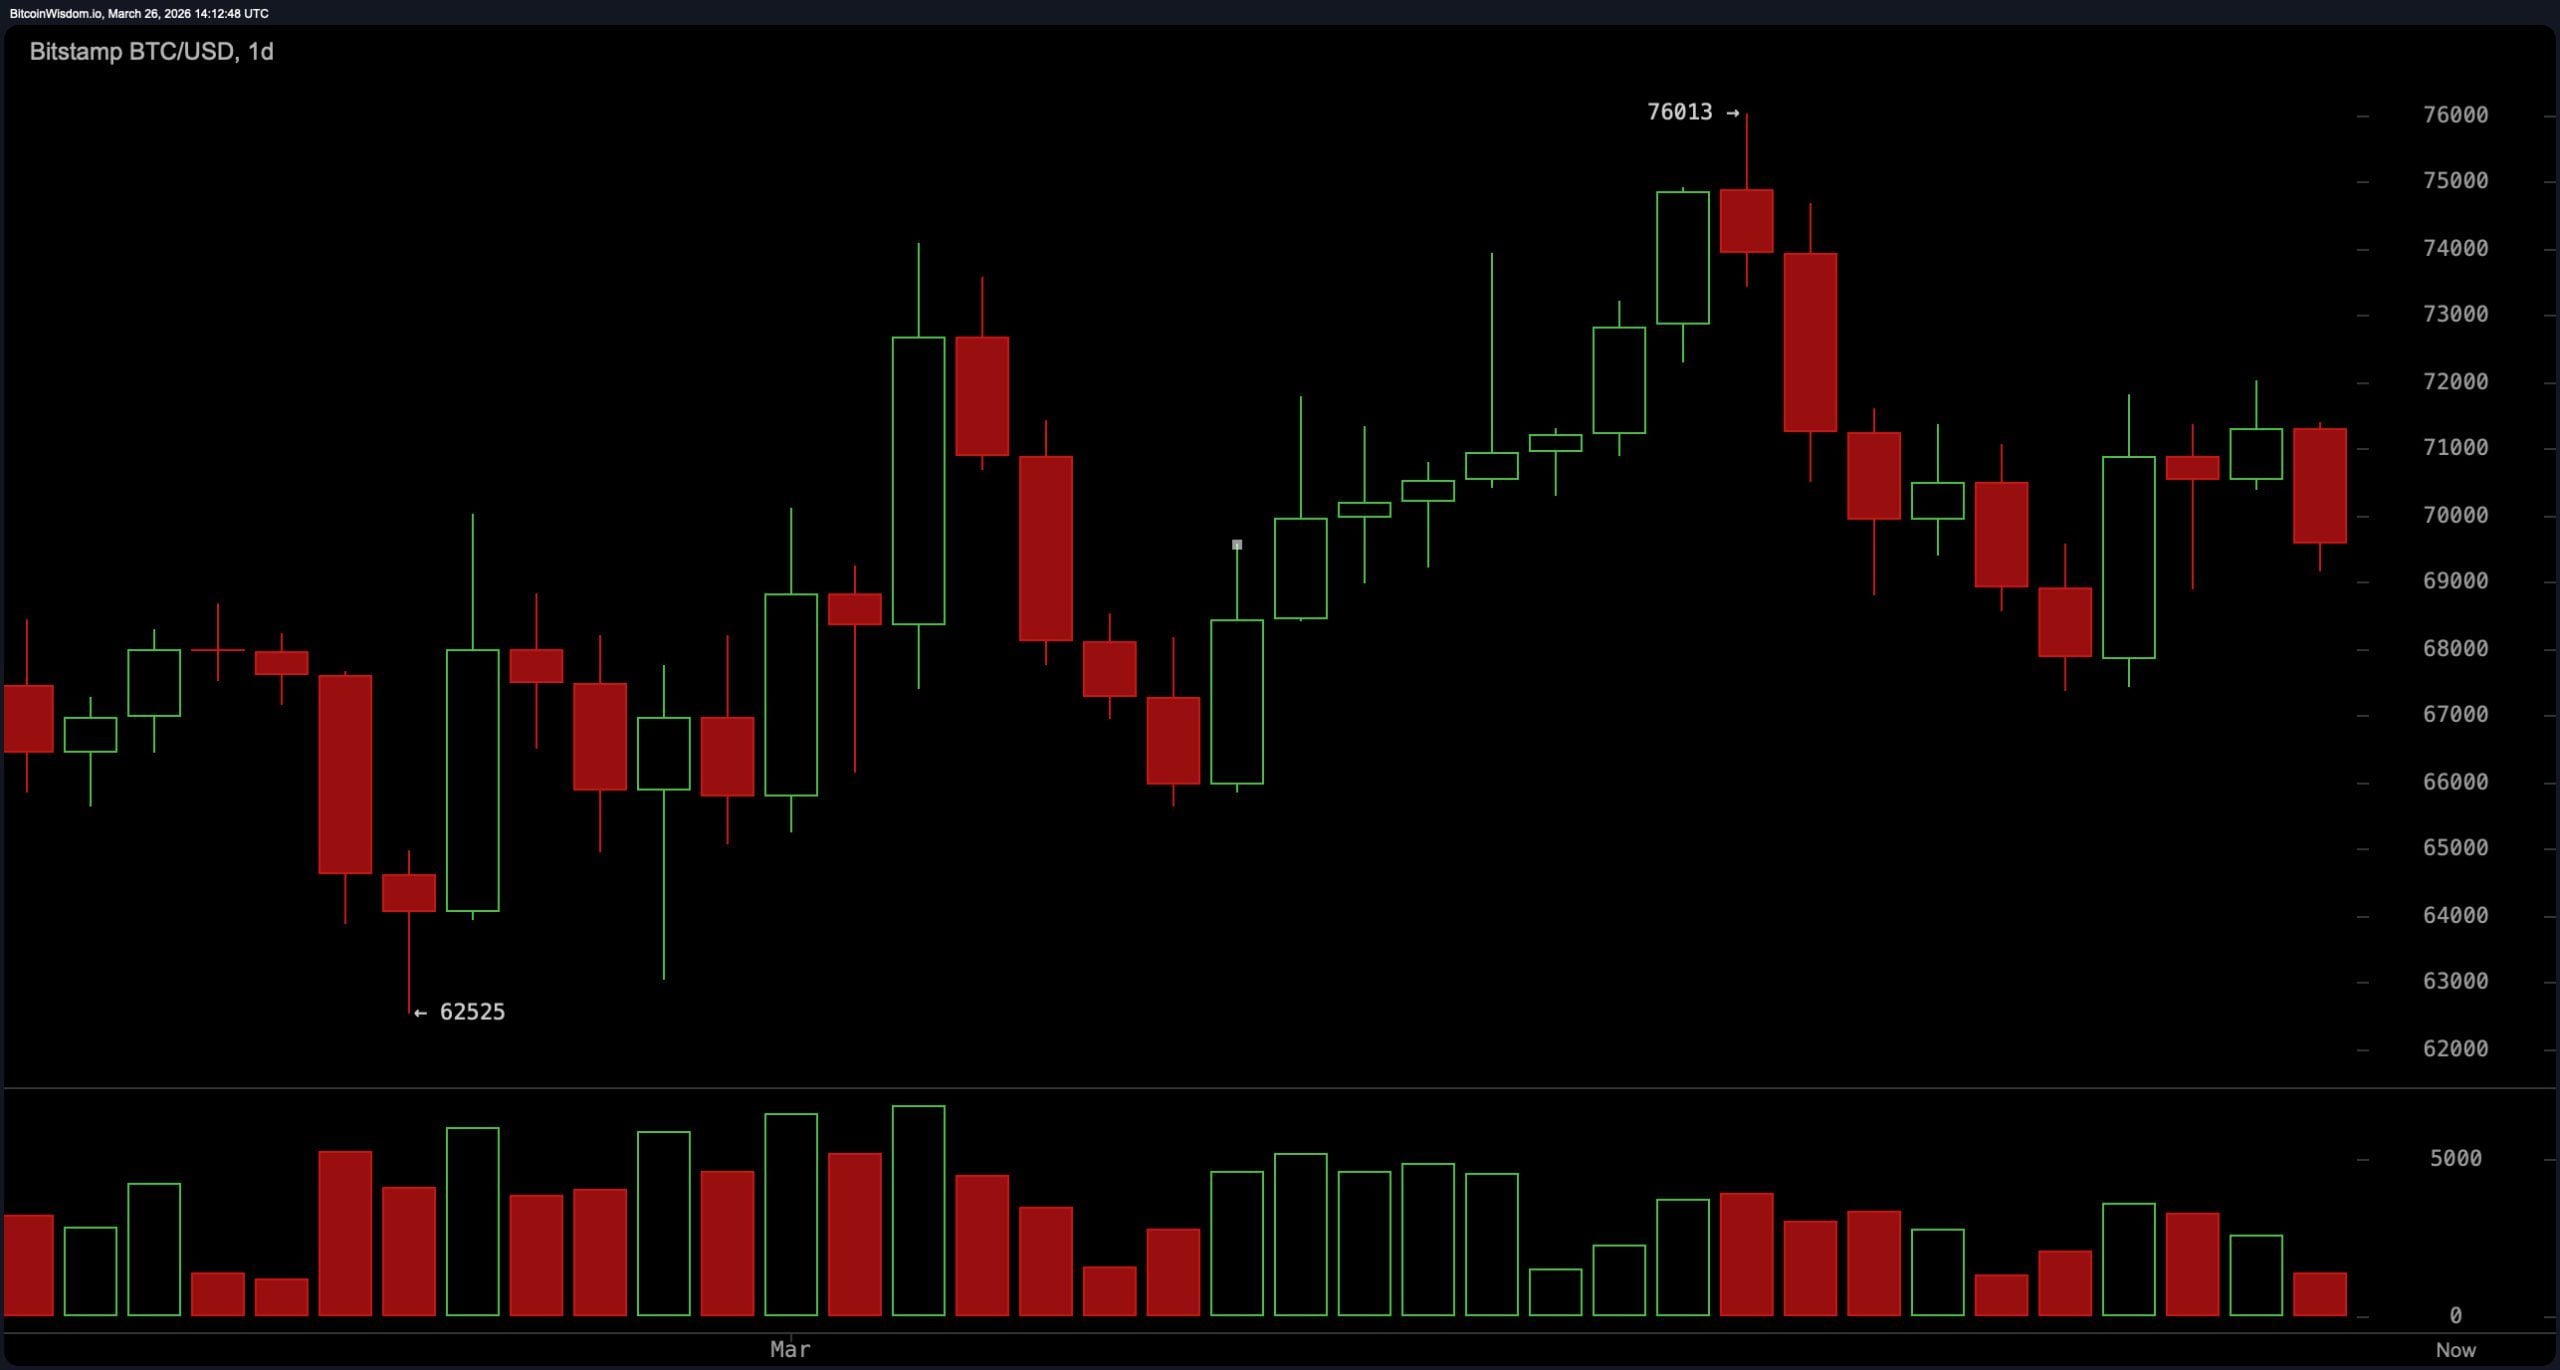
$BTC/USD one-day chart via Bitstamp on March 26, 2026.
On the four-hour chart perspective, bitcoin’s structure has weakened further. Recent price action indicates a pullback into the vicinity of $69,000 with difficulty maintaining levels above $70K. This downward shift within intraday trading ranges reflects mounting short-term pressure beneath surface dynamics. The overall sentiment remains cautious as attempts to rally have been unsuccessful in gaining traction.
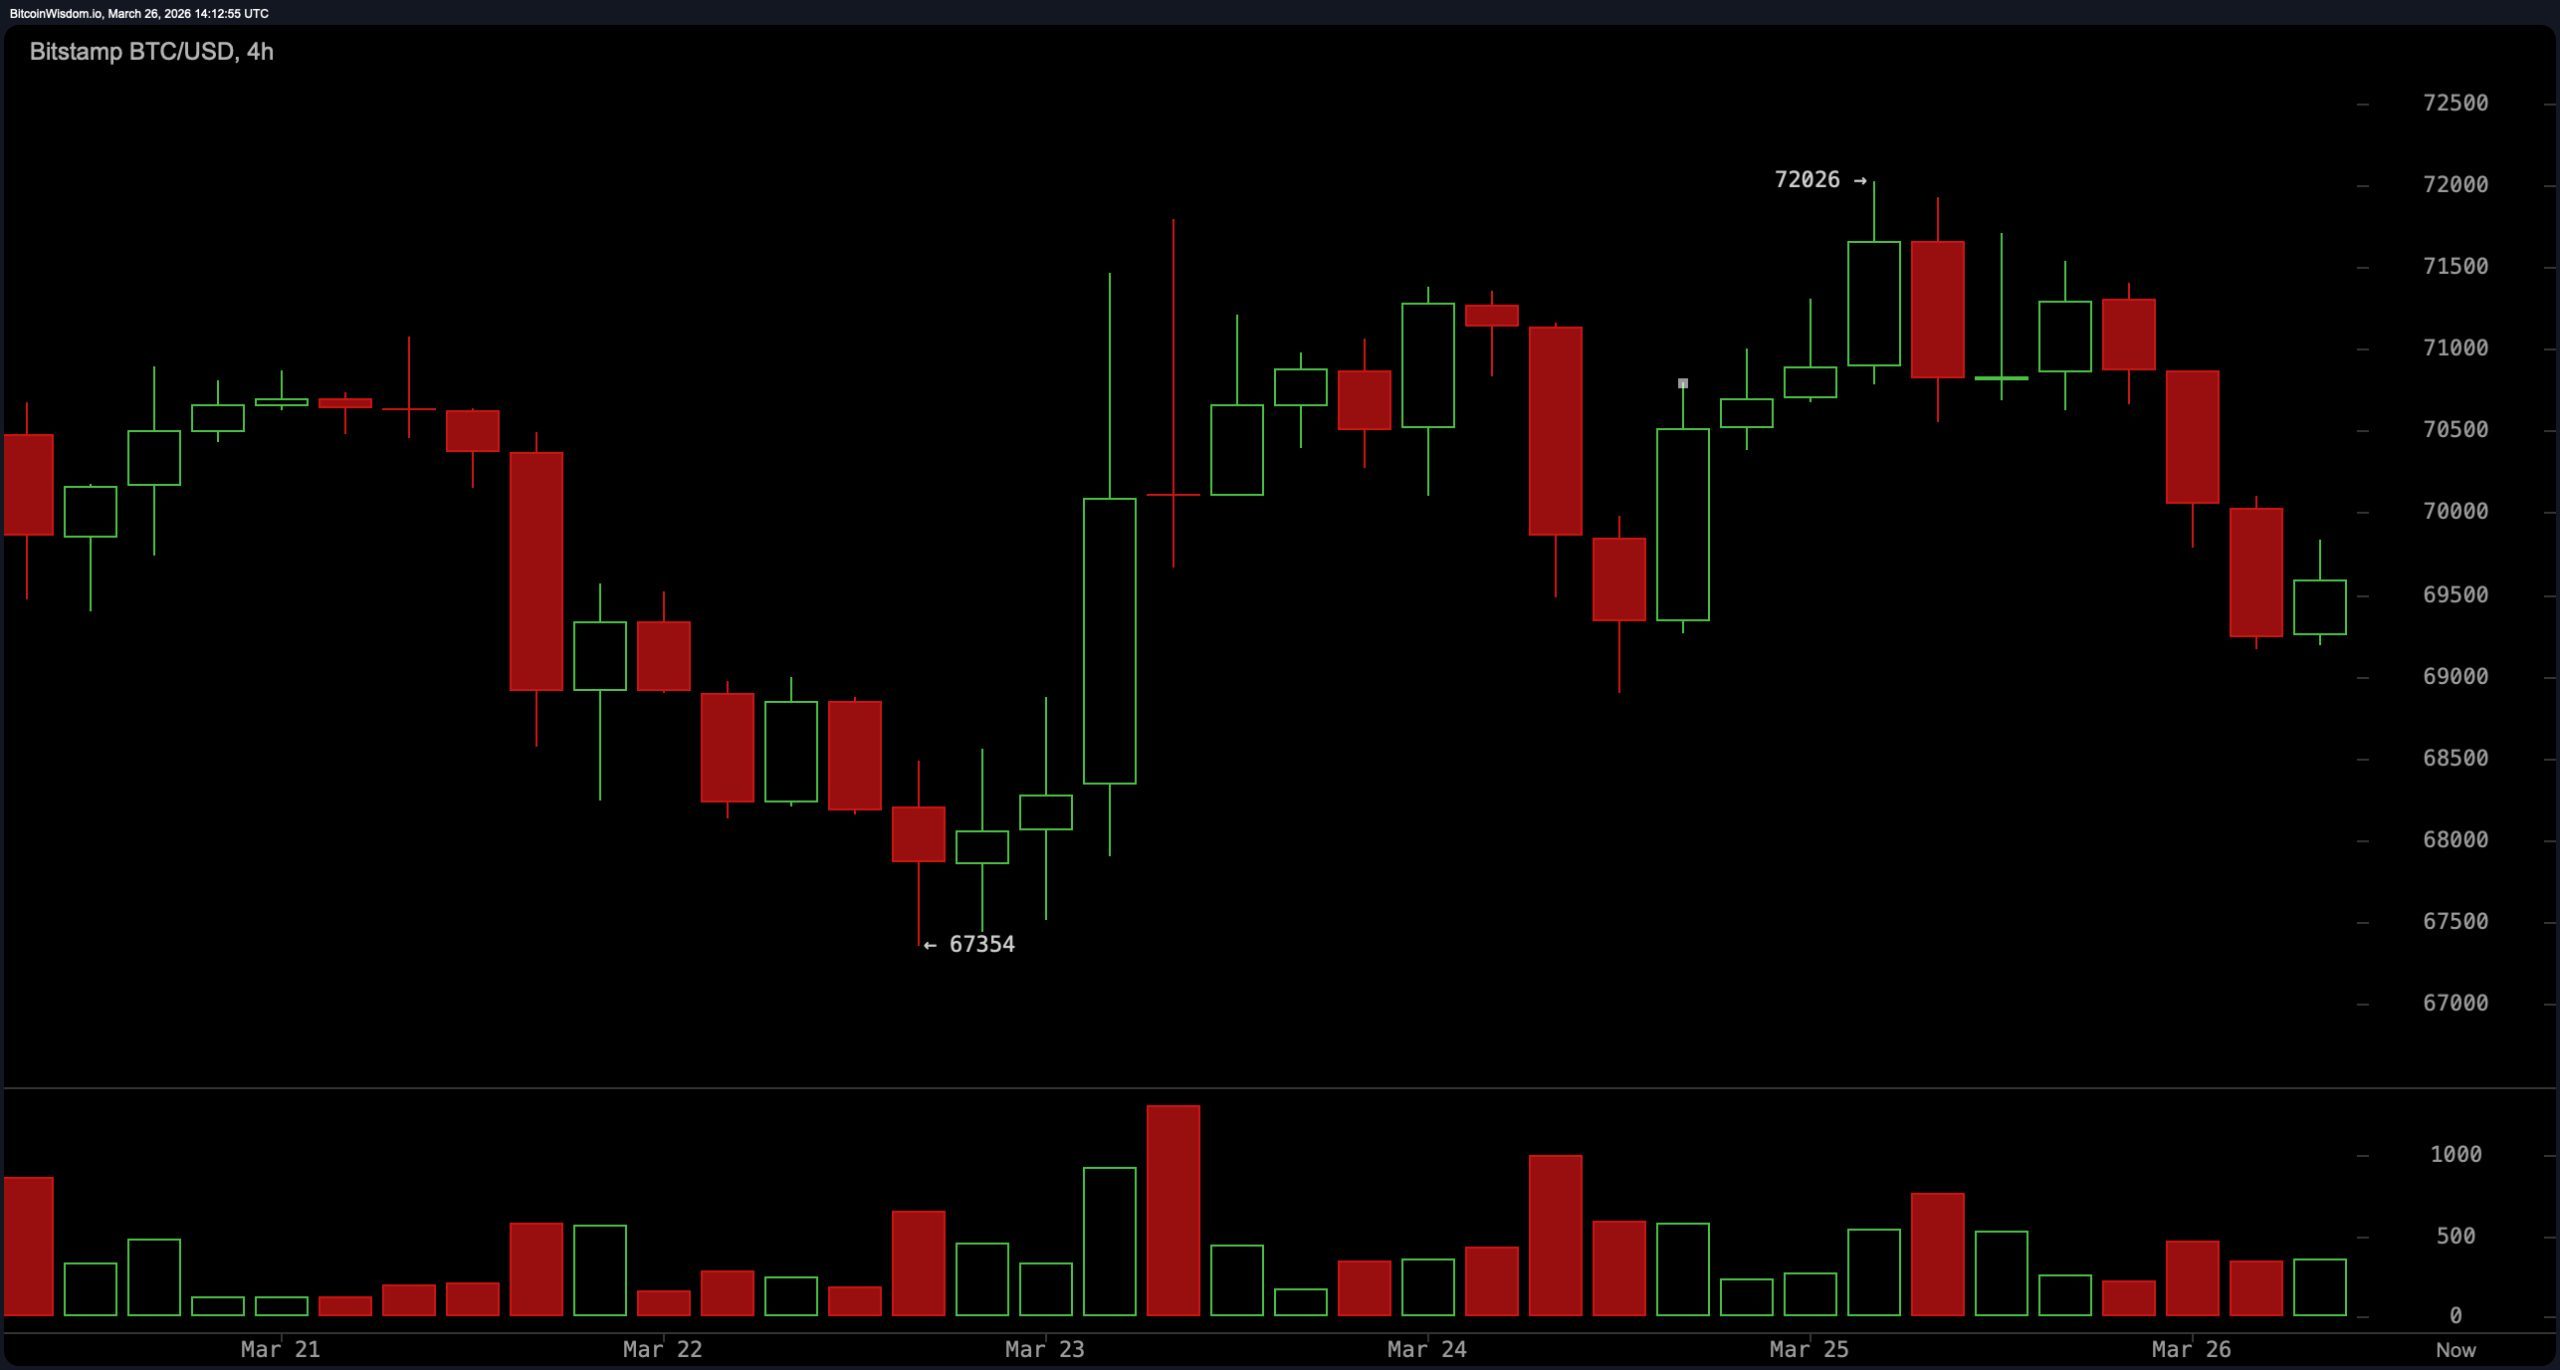
$BTC/USD four-hour chart via Bitstamp on March 26, 2026.
The one-hour Bitcoin analysis on Bitstamp reinforces this notion of short-term weakness; prices are tightly clustered around $69,519 with minimal volume trades suggesting low market participation. Such compression near support—particularly around the key level of $69,500—often precedes significant movement; however directionality remains uncertain. Order book data reveals buy orders concentrated at levels like $69K and below while immediate resistance looms just above between approximately $69،537 and$69،560 keeping prices constrained in tight boundaries.
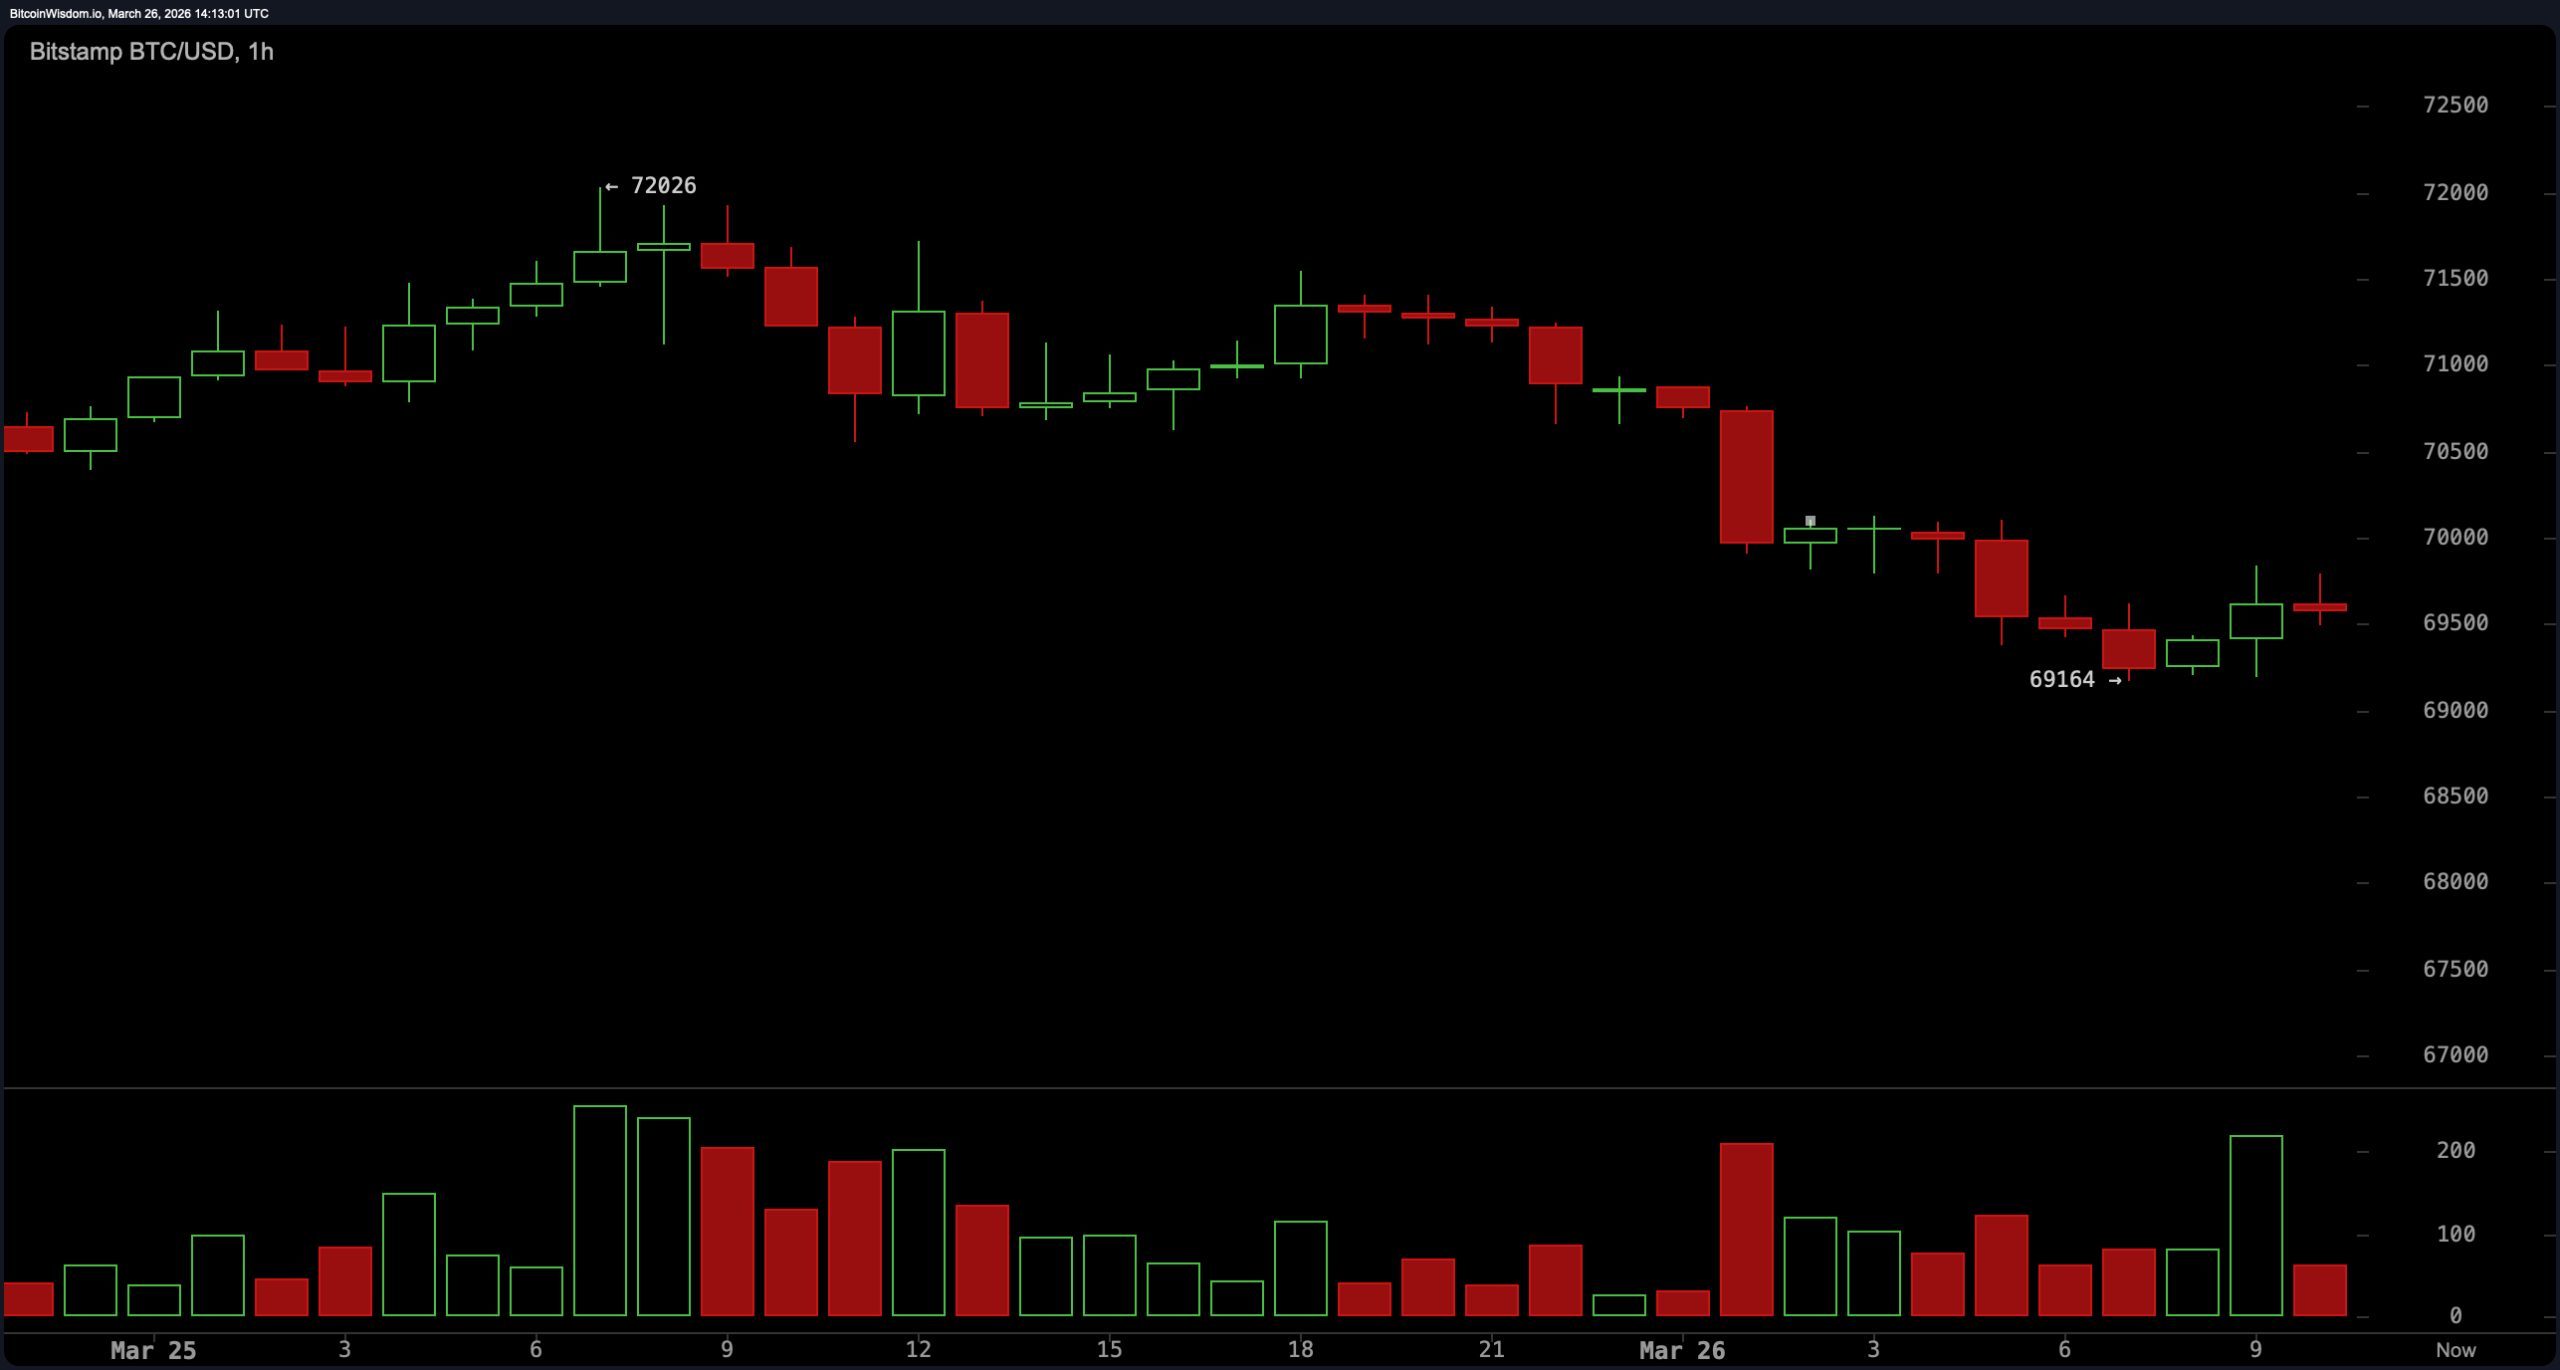
$BTC/USD one-hour chart via Bitstamp on March 26,2026.
Indicators based on daily oscillators show that momentum is lacking in this market environment—the relative strength index (RSI) sits at 48 while Stochastic registers at 36 along with commodity channel index (CCI) reading −16—all indicating neutral conditions alongside an average directional index (ADX) value reflecting weak trend strength set at just17.The Awesome oscillator also confirms neutrality here.
Nevertheless,momentum readings indicate −5,222 coupled with moving average convergence divergence(MACD)value sittingat44 signal potential downside pressures suggesting although it may seem balanced externally,underlying forces lean towards negative outcomes。
The moving averages display distinctly bearish tendencies despite sideways price movements.A cluster formed by exponential moving averages(EMA)and simple moving averages(SMA)presents13 bearish signals compared to only one bullish signal alongwith another neutral reading。
A clear delineation exists for short-term resistance marked by EMA(10)at$70、373andSMA(10)$70、474as well as EMA(20)$70、275andSMA(20)$70、350—all positioned above current pricing.Even though SMA(50)around68,887provides nearby support longer term metrics suchasEMA(100)around77,813andEMA(200)at86,062remain significantly elevated reinforcing substantial overhead resistance affecting pricing behavior overall。
Bullish Perspective:
If Bitcoin can maintain its position above crucial support located near$69kwhile adheringto broader daily structures,it preserves potential upside scenarios albeit without solid confirmation.Sustained movement surpassingthe bandofresistance rangingfrom$70。800to$71。500is necessaryfor shiftingmomentum awayfromcurrentweaknessotherwise bullish sentiments remain tentative rather than convincing .
Bearish Perspective:
Short-termmomentum continues its decline ,with negative indicators aligning againstprice actions accompaniedby multiple exponentialmovingaverages(EA)simplemovingaverages(SMAs )overhead.Failuretoremainabovecriticalsupportnear$69000couldexposeadditionaldownside risks toward deeper supports reinforcing visible underlying pressures already present .
Frequently Asked Questions 🔎
What is bitcoin’s price on March 26th ,2026? Bitcoin trades close to$$69678 consolidating followingpullbackfrom$$7157045 .
Isbitcoindownorupcurrently ? Short-termmomentum appears weaker even asthe larger dailyrange stays intact .
What are keysupport&resistancelevelsforbitcoin ? Support residesaround $$69000while resistancesitssafelybetween $$70800&$$71500 .
What do indicatorsrevealaboutbitcoins outlook? Oscillators largelyreflectneutrality butmomentum&MACDsignalingbearishsentiments .