
In the last 24 hours, Bitcoin has experienced an increase; however, recent evaluations indicate that this may be part of a larger bearish trend suggesting more significant declines ahead.
Bitcoin ($BTC) achieved an intraday peak close to $69,300 on Wednesday, marking a promising start for April. Nonetheless, market analyst TARA warns that this could foreshadow a potential drop of 15%, bringing prices below $60,000.
Main Highlights
The recent recovery in Bitcoin towards approximately $69,300 has revisited the critical 0.618 Fibonacci retracement level.
TARA’s analysis suggests that the leading cryptocurrency is likely to revisit this zone again since it did not fully absorb the available liquidity there.
The Relative Strength Index (RSI) remains below oversold levels, indicating room for a brief upward movement.
If Bitcoin manages to capture the remaining liquidity around $69,300 effectively, it may trigger a more pronounced downward movement toward $58,000.
Bitcoin Hits Fibonacci Threshold
TARA pointed out that today’s rise towards nearly $69,300 involved retesting the crucial 0.618 Fibonacci retracement level. Although Bitcoin subsequently fell back to around $68,200 after reaching its peak at approximately $69,273—just shy of this target—the movement was still significant.
The analyst believes another test of this level is likely due to incomplete liquidity absorption in that area. To provide context: it peaked at about $30 less than the identified Fibonacci target of $69,273.
This price behavior indicates some liquidity might still be present in this range. Given how closely $BTC approached its goal without hitting it directly suggests there could be another short-term attempt toward that zone before any reversal occurs.
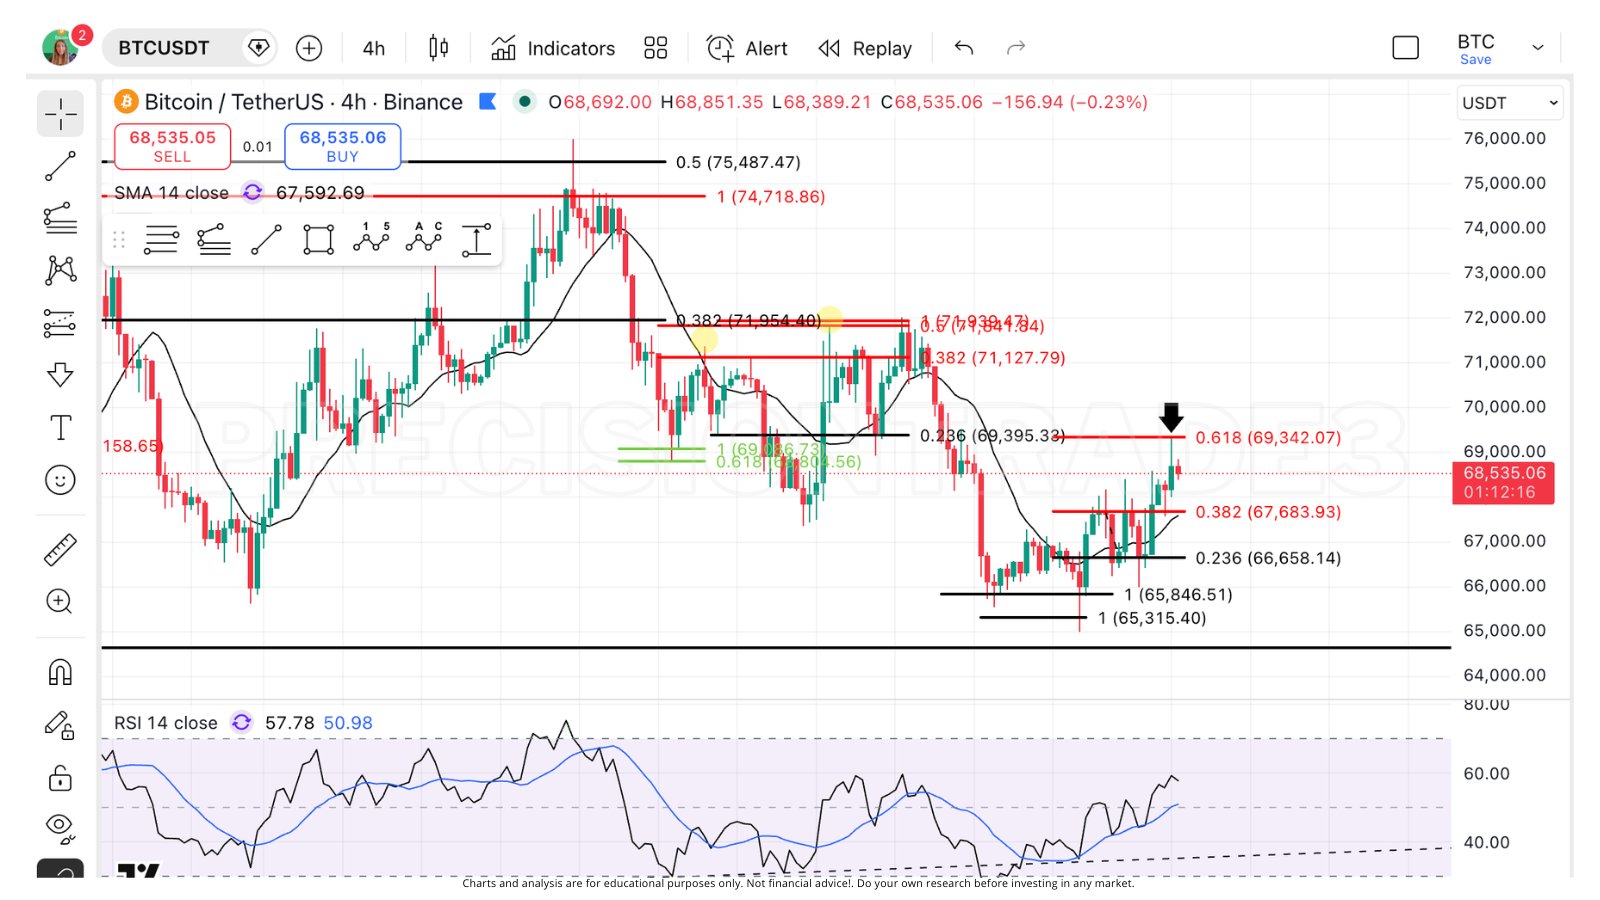
Additonally, momentum indicators align with this scenario as well; with RSI hinting at another possible attempt against resistance levels.The RSI currently sits beneath oversold conditions which supports short-term upward movements and reinforces expectations for Bitcoin potentially reclaiming its position near$69,300 before changing course again。