On Tuesday, March 31, 2026, at 8:30 a.m. Eastern Time, Bitcoin was priced at $66,597. The cryptocurrency’s market capitalization stood at $1.33 trillion with a trading volume of $48.8 billion over the past 24 hours, indicating active yet uncertain market engagement. Throughout the day, Bitcoin fluctuated within an intraday range of $66,037 to $68,130 as it consolidated just beneath significant resistance levels while broader technical indicators leaned towards a neutral-to-bearish outlook.
Bitcoin Chart Analysis
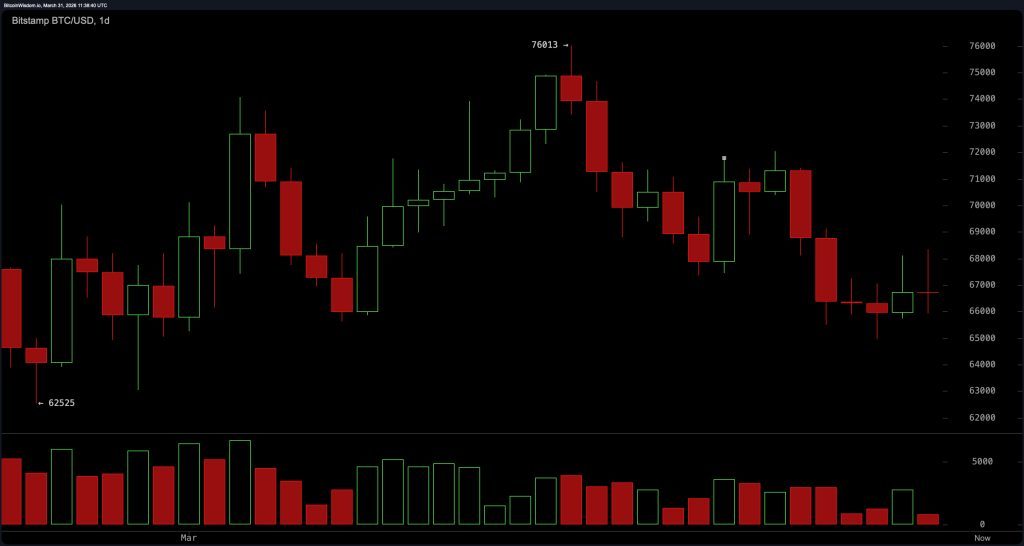
The daily chart for Bitcoin illustrates a shift from its previous bullish trend into a more neutral-to-bearish stance. After reaching lower highs in the mid-$70s range and subsequently retreating to the mid-$60s territory, it suggests diminishing upward momentum.
Resistance is notably clustered between $71,000 and $73,000 while intermediate resistance is found around the $68,000 to $69,000 mark. Support remains intact in the range of $65,000 to $66,000; however if prices fall below $64,000 consistently this could indicate a significant structural breakdown in market dynamics. Currently observed trends do not support any strong directional bias but rather suggest characteristics typical of distribution.
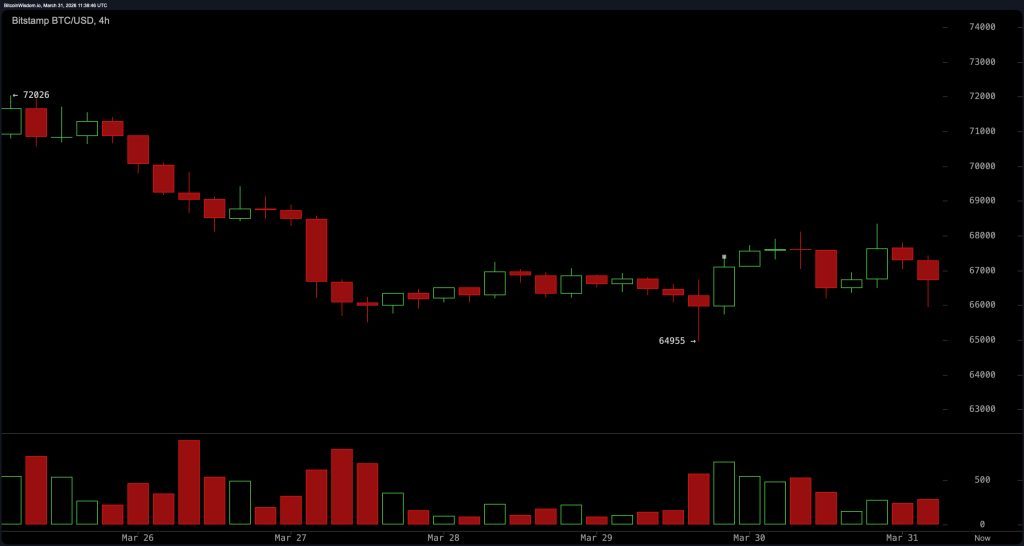
The four-hour analysis reveals that Bitcoin has transitioned from its downtrend into consolidation mode after establishing higher lows near the price point of around $65K; however subsequent rebounds have lacked vigor and continue stalling beneath resistance levels ranging from approximately $68K to $69K—indicating indecisive market participation during this compression phase.
Support remains robust at about $65K with breakdown potential just under $64K; thus far reinforcing an environment characterized by price oscillation within defined ranges as sellers persist despite short-term stabilization efforts.
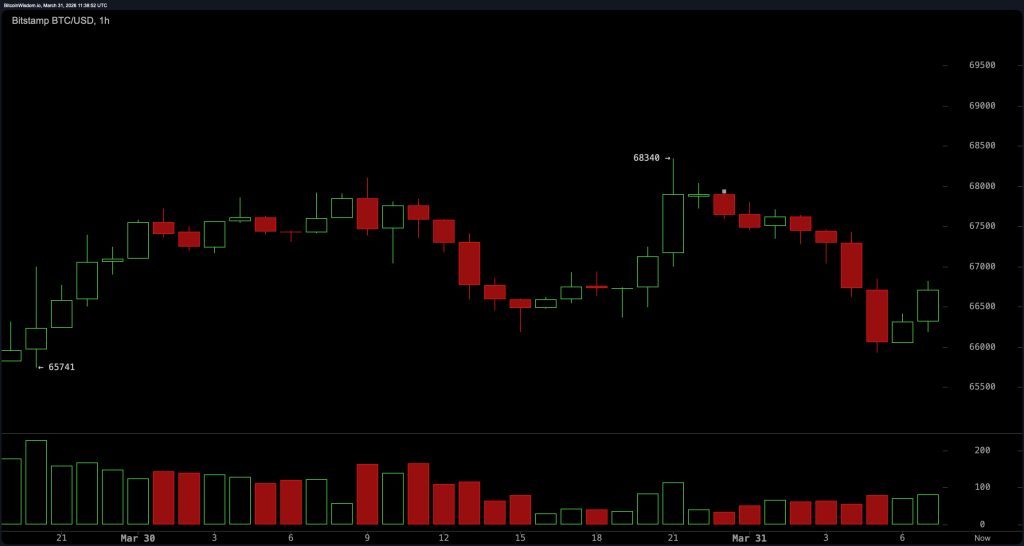
A closer look at the one-hour timeframe indicates weak short-term momentum where lower highs remain consistent while prices drift sideways exhibiting slight bearish tendencies.
A minor rebound from around $66K has failed to gain traction further emphasizing insufficient buying pressure present within this microstructure which oscillates tightly without forming clear breakout patterns.
This timeframe supports an overarching narrative suggesting consolidation alongside downside risks unless substantial resistance reclaim occurs decisively moving forward.
Oscillators provide mixed signals overall reflecting generally uninspiring conditions—the relative strength index (RSI) stands at 42 indicating subdued momentum whereas both Stochastic readings along with average directional index (ADX) confirm absence of strong trending behavior presently seen across markets.
The commodity channel index (CCI) reads -104 alongside momentum indicators hinting towards possible reactive strength albeit lacking confirmation through broader metrics such as MACD which remains negative (-947), reinforcing underlying bearish sentiment despite sporadic counter-movements observed recently across various charts available today overall aligning these oscillators closer toward neutrality albeit slightly skewed toward weakness currently noted throughout analyses conducted thus far!
Moving averages deliver clear signals—notably persistent downside pressure indicated by exponential moving average (EMA) & simple moving average(SMA)—both remaining above current pricing points showing no signs reversing course anytime soon! Short-term averages like ten-period EMA ($67k+) & SMA ($68k+) restrict upside attempts significantly whilst longer term measures such as fifty-period EMA($71k+), hundred-period EMA($76k+), two-hundred period EMA($85k+) only serve further reinforce prevailing bearish structure witnessed lately due largely trading occurring below every major MA metric established previously! Hence technically constrained trends prevail where any potential upside movement continues facing layered resistances overhead awaiting resolution going forward!
Bullish Perspective:
A decisive break followed by sustained holding above key resistances between approximately $68-69 thousand backed up rising volumes/momentum confirmations would invalidate current compression narratives signaling shifts towards recovery potentially challenging higher bands ahead!
Bearish Perspective:
If continued rejections occur below thresholds set near roughly around or under six-five-thousand combined with breakdowns penetrating areas close enough toward sixty-four-eight-hundred confirming ongoing bear continuation aligns perfectly against dominant pressures exerted upon respective moving averages opening pathways leading downward targeting even lower supports found nearer low sixties eventually!
Frequently Asked Questions 🧭
What’s bitcoin’s projected pricing outlook for March thirty-first twenty-six?
Bitcoin appears trapped within ranges hovering close enough nearing sixty-seven thousand dominated primarily by neutral/bearish technical signals presently visible across multiple charts analyzed recently.
Is bitcoin experiencing bullishness or bearishness currently?
At present timeframes indicate consolidation phases characterized predominantly leaning slightly more negatively given existing overhead resistances coupled together weak overall marketplace dynamics exhibited lately!
What are some critical support/resistance zones associated with bitcoin right now?
Key supportive areas exist firmly positioned anywhere between sixty-five/six-six thousand meanwhile notable resistances congregate heavily situated surrounding regions spanning nearly seventy-one/seventy-three thousand respectively.
How do various technical indicators reflect upon bitcoins standing today?
Oscillators mainly exhibit neutrality although movements concerning MAs highlight persistent downward pressures being felt continuously throughout recent sessions tracked closely since then!