Bitcoin is currently facing persistent selling pressure, hovering around $71.5K as the market grapples with one of the most significant corrections since the bear market of 2022. With key moving averages still trending downward and no major structural levels being reclaimed, it appears that a downward trajectory remains likely until there are clear signs to suggest otherwise.
Analysis of Bitcoin Prices: Daily Chart Overview
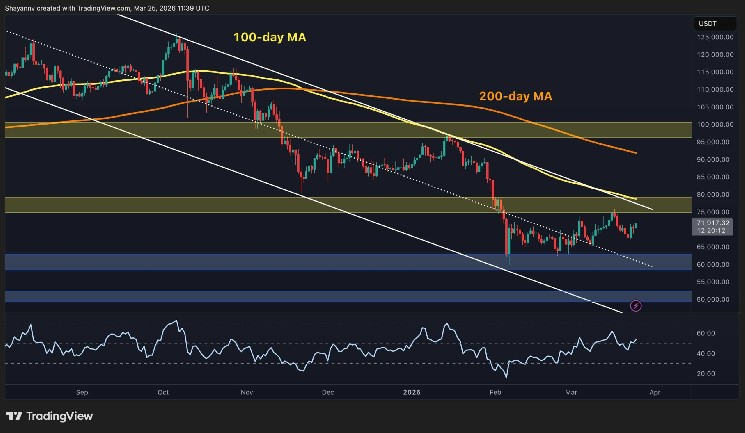
$BTC continues to operate within a descending channel on its daily chart. The 100-day moving average (approximately $79K) and the 200-day moving average (around $92K) serve as critical resistance points overhead. The price zone between $75K and $80K, which provided strong support throughout much of late 2025, has now transformed into resistance, thwarting any recovery attempts in recent weeks.
The Relative Strength Index (RSI) has made a notable recovery from its lows in February below 20 and is currently trending around the mid-50s—a positive development but still not reaching the bullish territory required for signaling a trend reversal. Key support levels remain at approximately $60K–$62K, with $50K acting as another significant level should this area fail to hold.
$BTC/USDT Four-Hour Chart Analysis
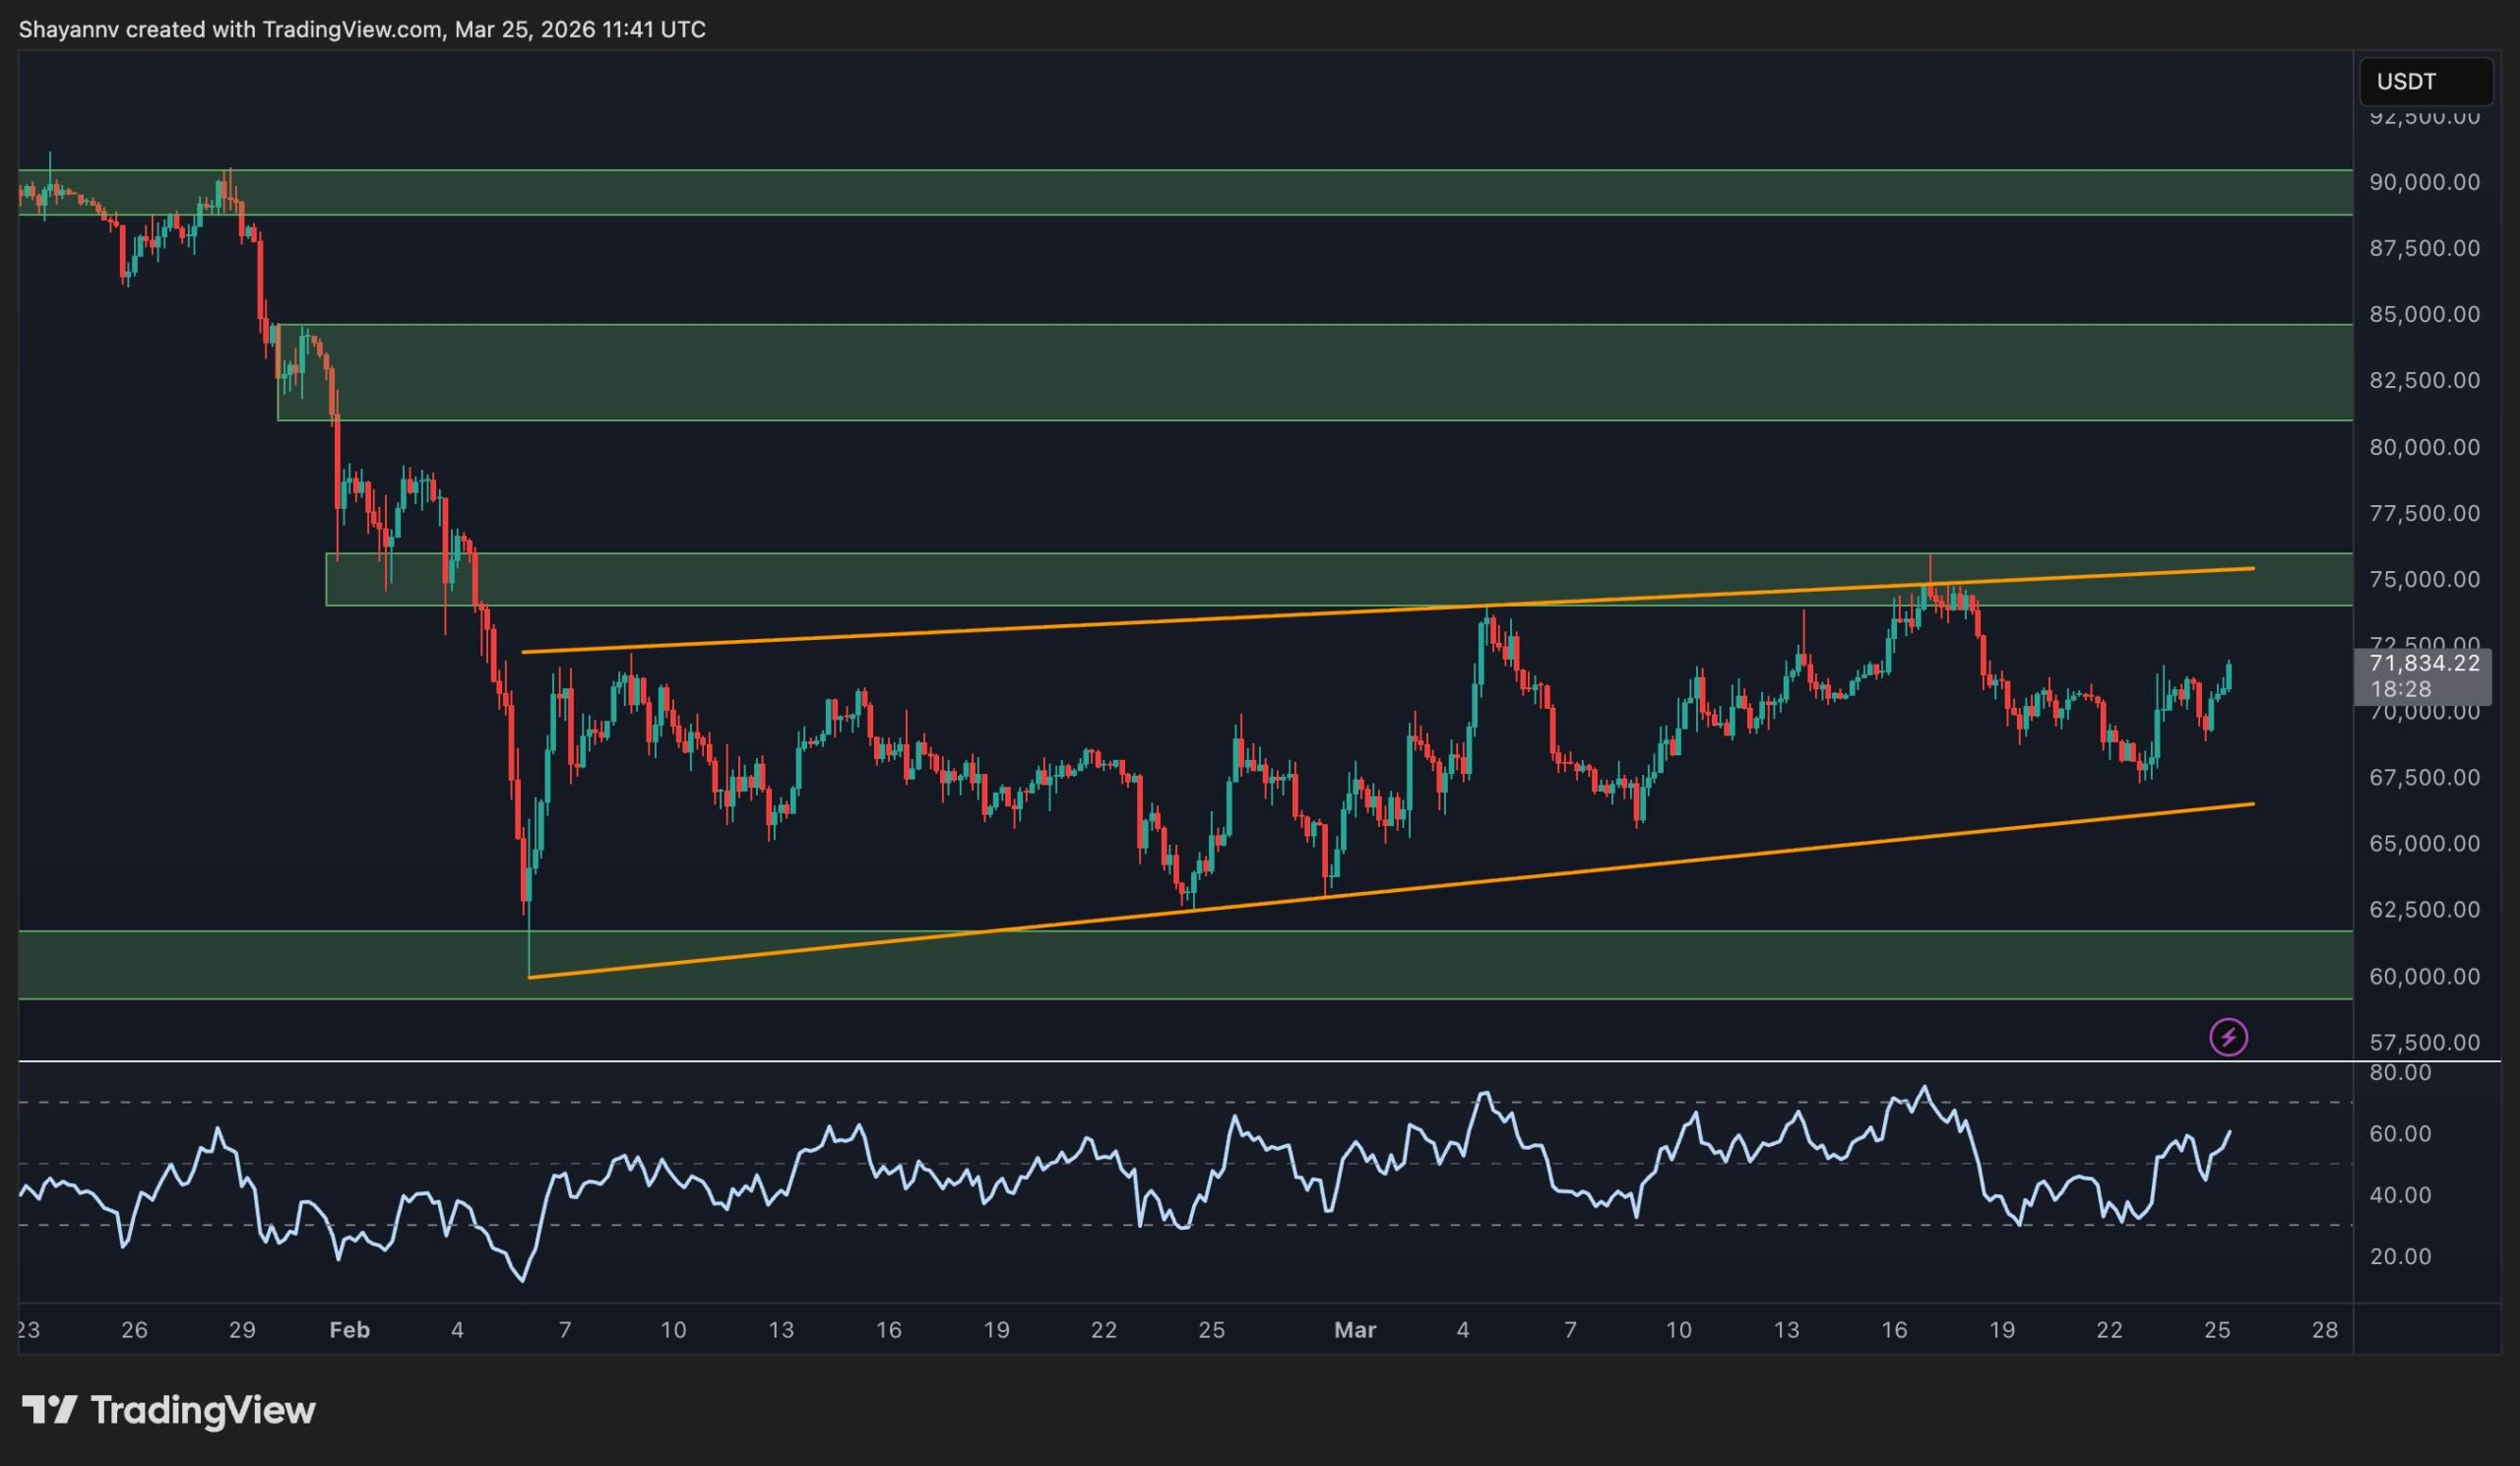
On the four-hour chart, $BTC is consolidating within a symmetrical triangle that has been developing since early February; currently trading near $71.5K at about midpoint within this pattern. The upper boundary close to the supply zone at around $75K has consistently rejected upward movements in price, marking it as an immediate resistance level worth monitoring.
The RSI for this timeframe has rebounded from low-30s values and is now rising above 60—indicating that short-term buying momentum may be building up. A decisive breakout above both the triangle’s upper trendline and through the resistance band at $75K would signal potential short-term bullishness; conversely, if prices fall below $62K, it could lead to further declines beneath February’s support zone and perpetuate an overall downtrend.
Market Sentiment Analysis
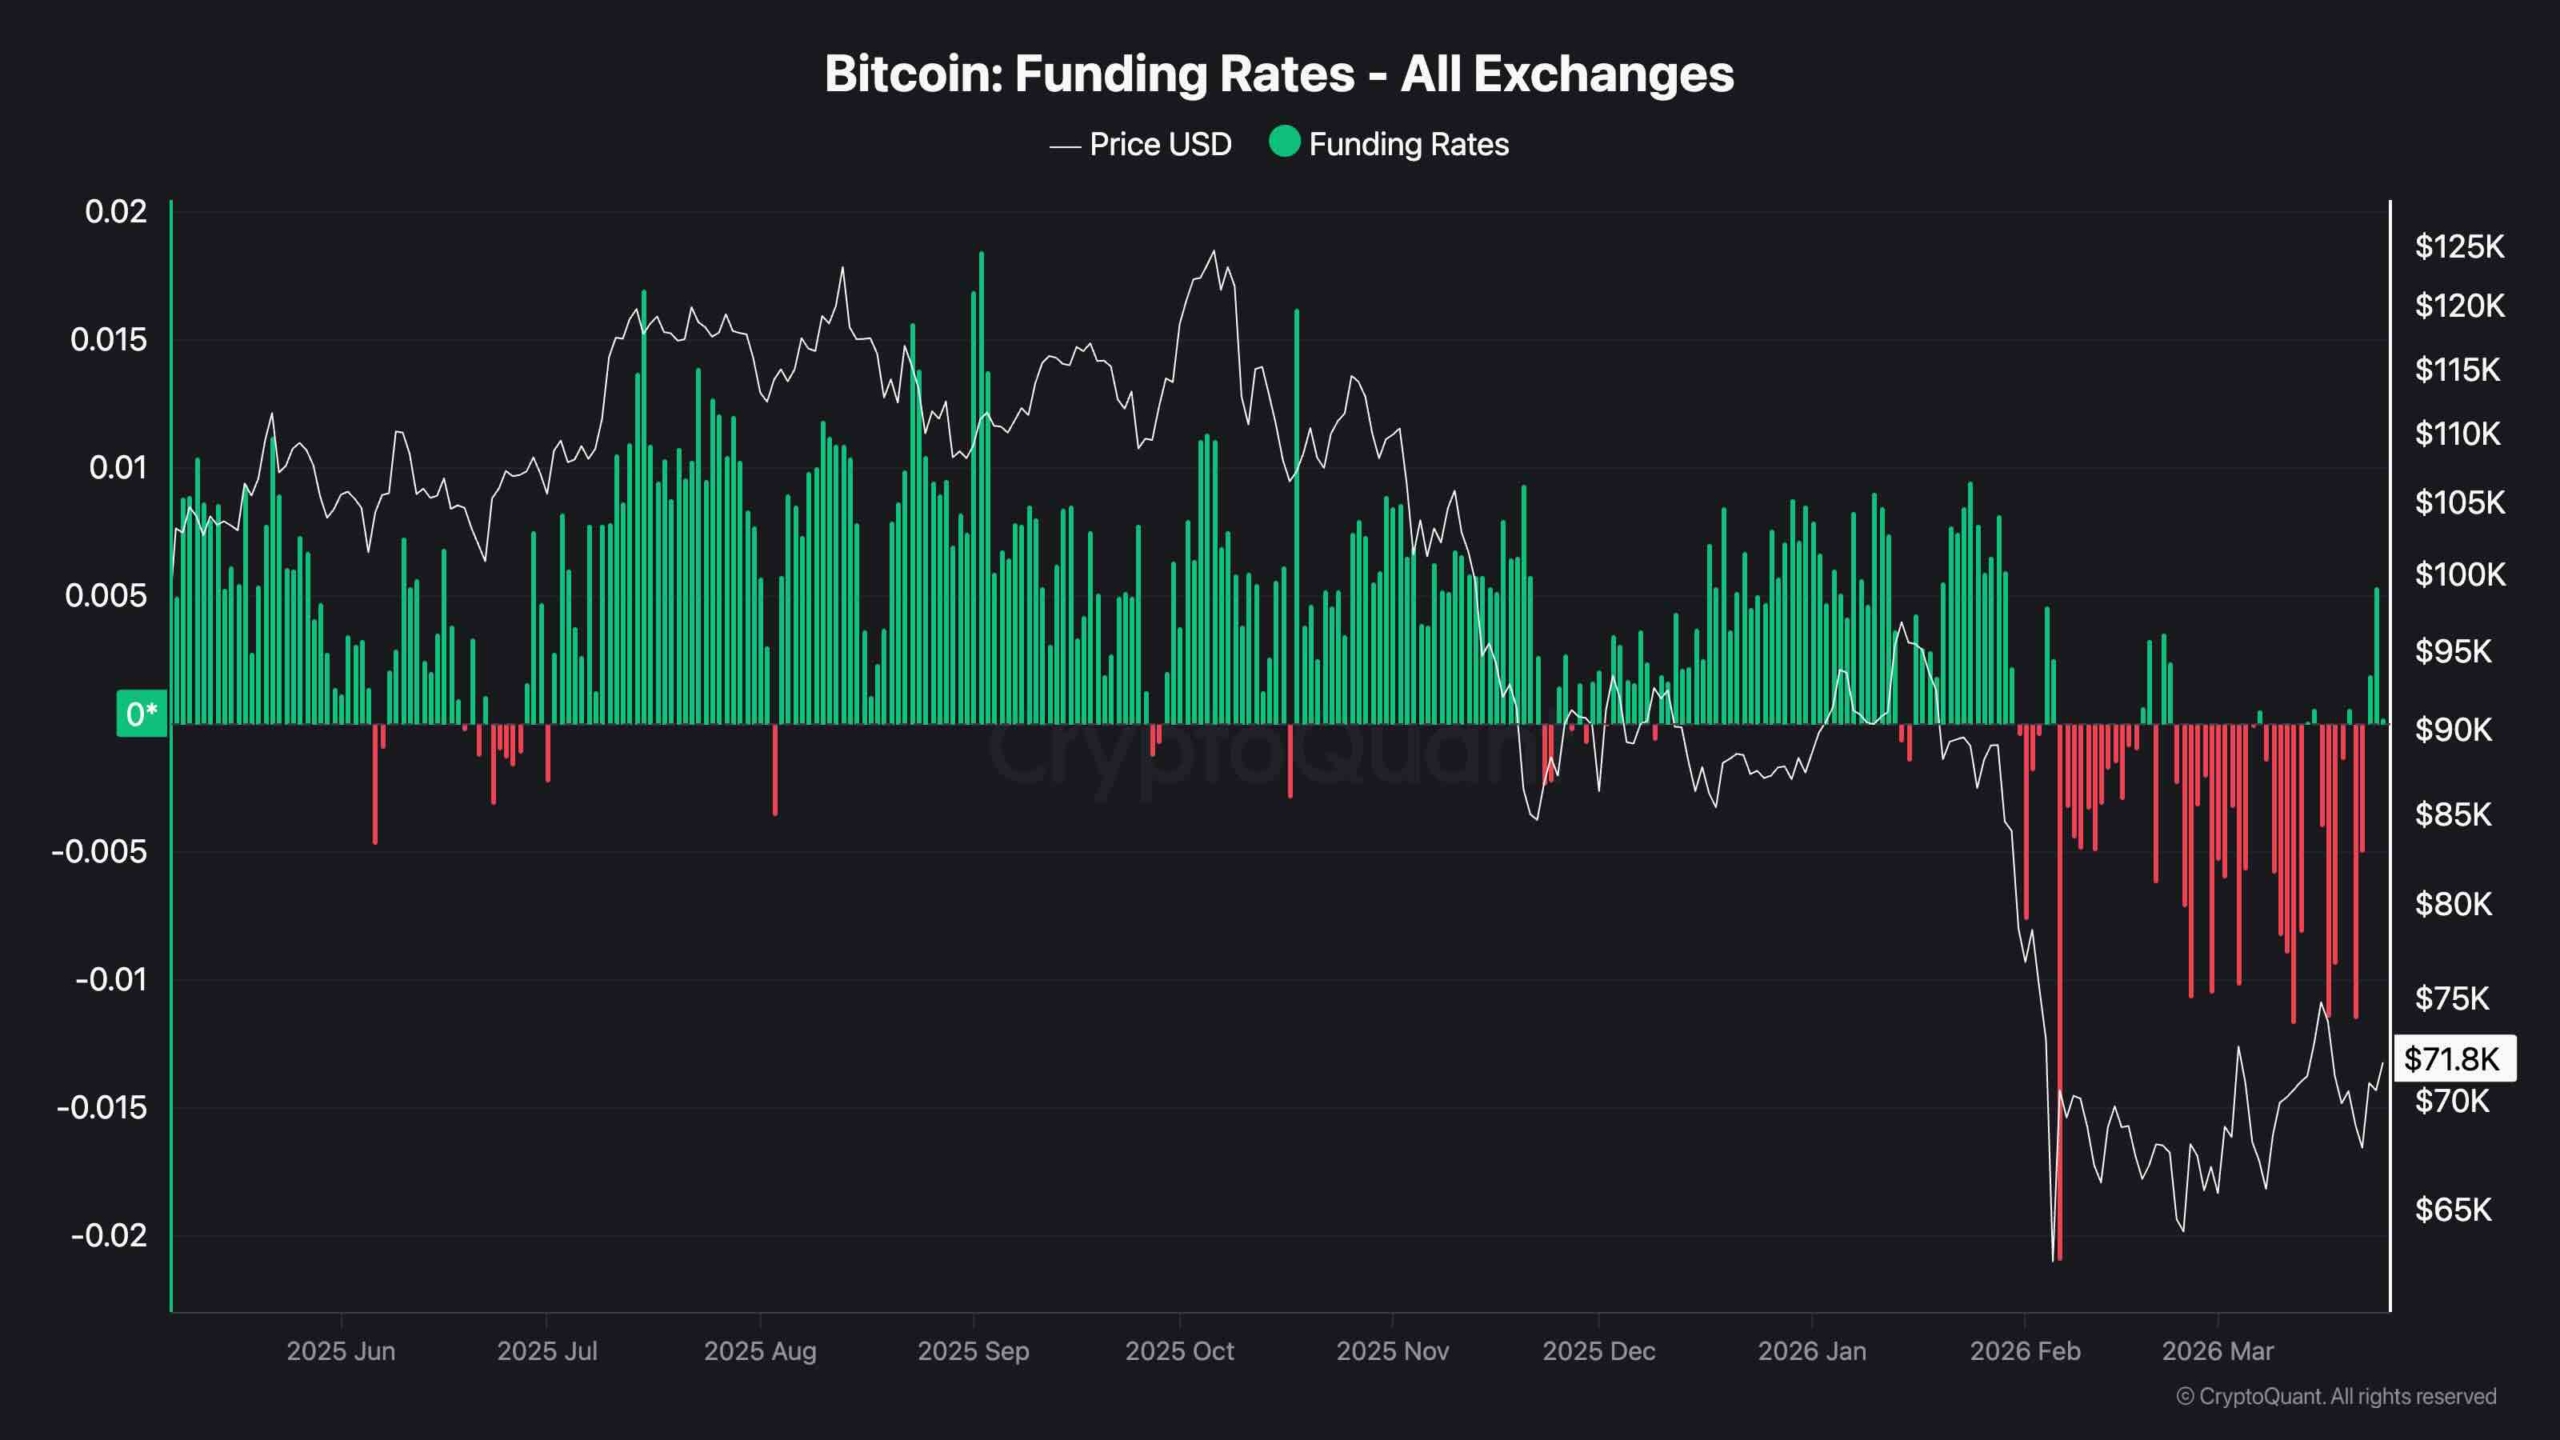
Since late January, funding rates across various exchanges have predominantly remained negative—a stark contrast compared to consistently positive readings observed during Bitcoin’s bull run in 2025. This ongoing negativity indicates an overcrowded short position within futures markets which can historically trigger a short squeeze if spot demand increases significantly.
However, it’s important to note that negative funding alone does not constitute a bullish signal. The extended period marked by red bars since February suggests traders were actively betting against any potential recovery rather than merely hedging their positions—until recently when rates have shown slight positivity again this week. Until there’s reclaiming of key structural levels on daily charts by prices themselves, current funding data should be interpreted more as evidence of bearish sentiment rather than contrarian buying opportunities.