Bitcoin is currently exhibiting two new bullish indicators as demand in the spot market increases, and a breakout from a bull flag suggests potential for further gains. The combination of these charts indicates that buyers are still backing this upward movement while traders monitor whether the momentum can reach the next significant target.
Increased Spot Demand for Bitcoin Amid Aggressive Futures Trading
The activity on the buy side for Bitcoin has intensified as spot demand rises alongside an increase in futures positions. Analyst Ted Pillows shared insights on X, highlighting that spot demand remains a crucial factor driving the current market dynamics.
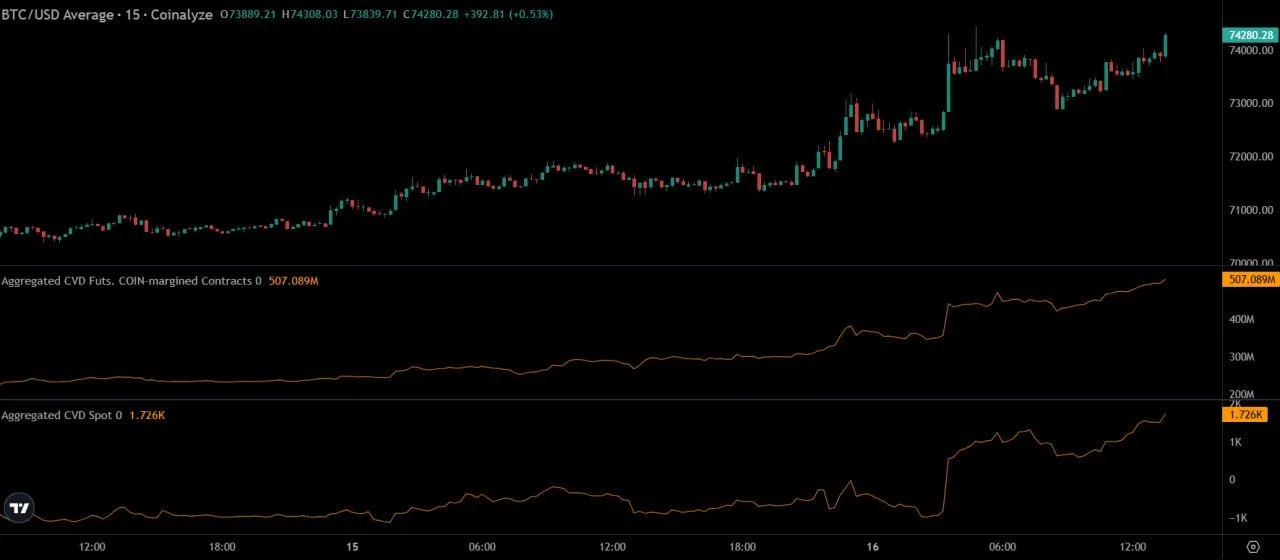
Cumulative Volume Delta (CVD) Analysis of Spot and Futures Demand. Source: Ted Pillows
This chart illustrates cumulative volume delta for both coin-margined futures and spot markets, measuring the difference between aggressive buying and selling activities. An increase in this indicator signifies that buyers are placing market orders more frequently than sellers.
The chart reveals an upward trend in both futures and spot CVD as Bitcoin rises within intraday timeframes. The CVD for futures has shown consistent growth, indicating that perpetual futures traders are increasingly opening long positions while prices continue to ascend.
Simultaneously, there is a notable spike in spot CVD, suggesting direct accumulation within the market. Spot demand typically holds greater significance because it reflects actual purchases rather than speculative trading actions involving leverage.
Ted Pillows emphasized that understanding how these two forces interact is essential. While aggressive positioning in futures can accelerate price movements, stability tends to persist only when there are sufficient spot buyers absorbing available supply.
If there’s a decline in spot demand while leveraged long positions keep increasing, it could lead to rapid liquidations within the market. Nevertheless, current charts indicate that growing accumulation from spots combined with rising derivatives activity supports Bitcoin’s latest uptrend.
Bull Flag Breakout Indicates Potential Movement Towards CME Gap
An analysis by James Easton on X reveals that Bitcoin has successfully broken out of a bull flag pattern observed on its four-hour chart. This breakout shows prices surpassing a descending consolidation structure formed after an earlier rally—indicating renewed bullish momentum through this continuation pattern.

Bull Flag Breakout Analysis with CME Gap Structure Insights. Source: James Easton
A bull flag generally forms when prices pause following a sharp rise before consolidating within downward-sloping channels; here it persisted over several sessions until Bitcoin broke above its upper trendline near previously established horizontal resistance levels—confirming changes in market structure.
This breakout represents significant technical progress; once prices surpassed this level of resistance, they transitioned from consolidation into continuation mode—a scenario traders closely watch since such breakouts often lead to follow-up buying as short-term resistances convert into support levels.
Additonally,James Easton pointed out potential implications regarding CME gaps illustrated on his chart; these gaps emerge when substantial price movements occur during closures at Chicago Mercantile Exchange’s future markets—resulting in noticeable price discrepancies between trading sessions—and historically tend to draw considerable attention due their tendency towards revisiting those areas later down trends。
With resolved flag structures coupled with breached resistances,the chart outlines prospects targeting higher regions associated with those CME gap areas。The arrow depicted suggests subsequent phases may aim toward those zones if upward momentum persists。