Bitcoin is currently navigating a challenging landscape, caught between significant resistance overhead and robust support beneath. Recent liquidity metrics indicate that the market is approaching a pivotal moment. A breakthrough in either direction could trigger rapid price movements as it seeks out the next substantial liquidity zone.
Bitcoin Heatmap Indicates Support Formation Above Channel Break
A Bitcoin heatmap from Columbus reveals that the market is beginning to accept trading above a descending channel, with new bid liquidity emerging throughout the order book. This chart suggests a potential structural change as support starts to form at lower levels following the recent upward movement.
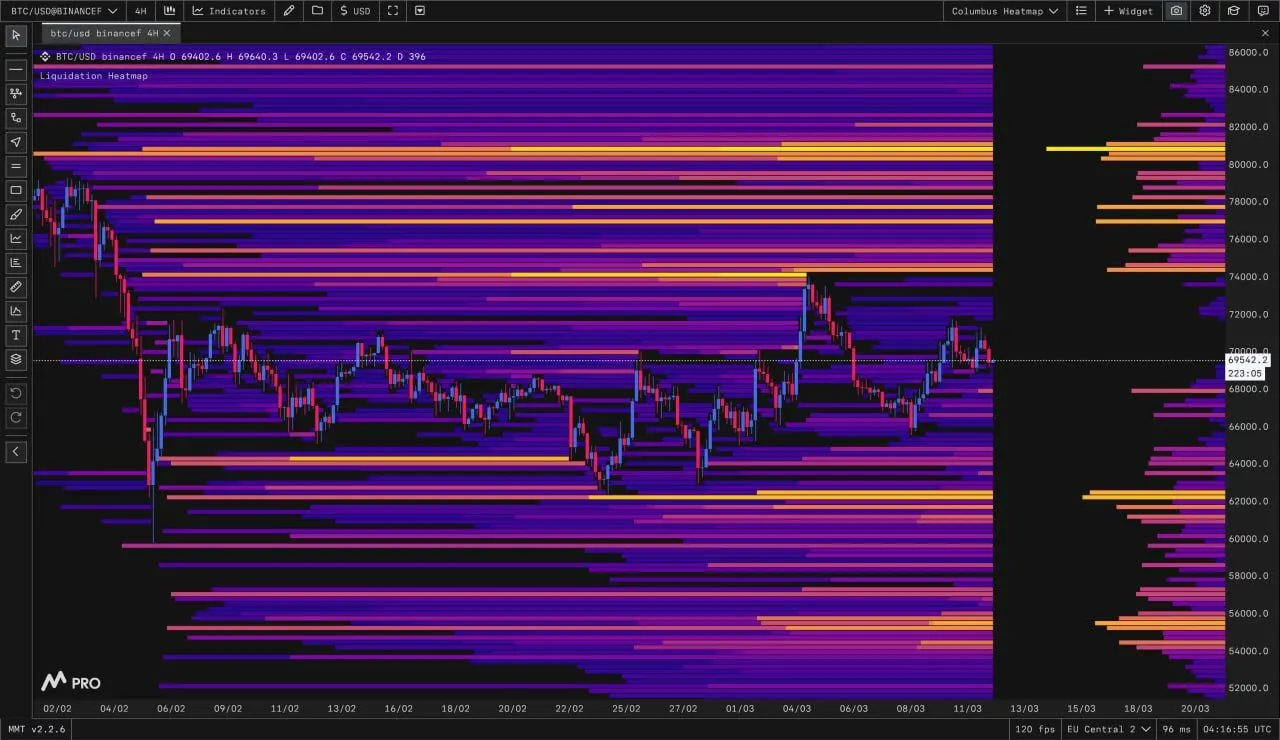
Bitcoin MMT Heatmap. Source: Columbus
The visualization illustrates dense clusters of liquidity both above and below the current trading range, with significant buying interest developing around $68,000. Analysis indicates this level corresponds to previous channel resistance and may now serve as support if Bitcoin experiences a pullback. Such retests are often instrumental in confirming whether breakouts are sustainable.
Concurrently, heavier liquidity appears overhead, particularly within higher price brackets. Should Bitcoin maintain its position above the broken channel, this upper liquidity could become an attractive target for prices moving forward. In such an event, traders might quickly gravitate toward these areas where larger orders reside.
This chart implies a two-phase structure: initially revisiting the $68,000 area where bids are evident; subsequently defending that level could facilitate further upward movement towards higher liquidity zones beyond the current range.
Whale Orders Indicate Potential for Rapid Movement Post-Range Break
Simultaneously, Bitcoin finds itself within a narrow whale liquidity zone characterized by substantial sell orders positioned between $71,000 and $72,500 while strong buy support gathers around $69,000 to $68,700 according to data from CoinGlass’s whale order chart. This configuration suggests that prices are being squeezed between large opposing blocks of liquidity—a scenario often leading to swift movements once one side capitulates.
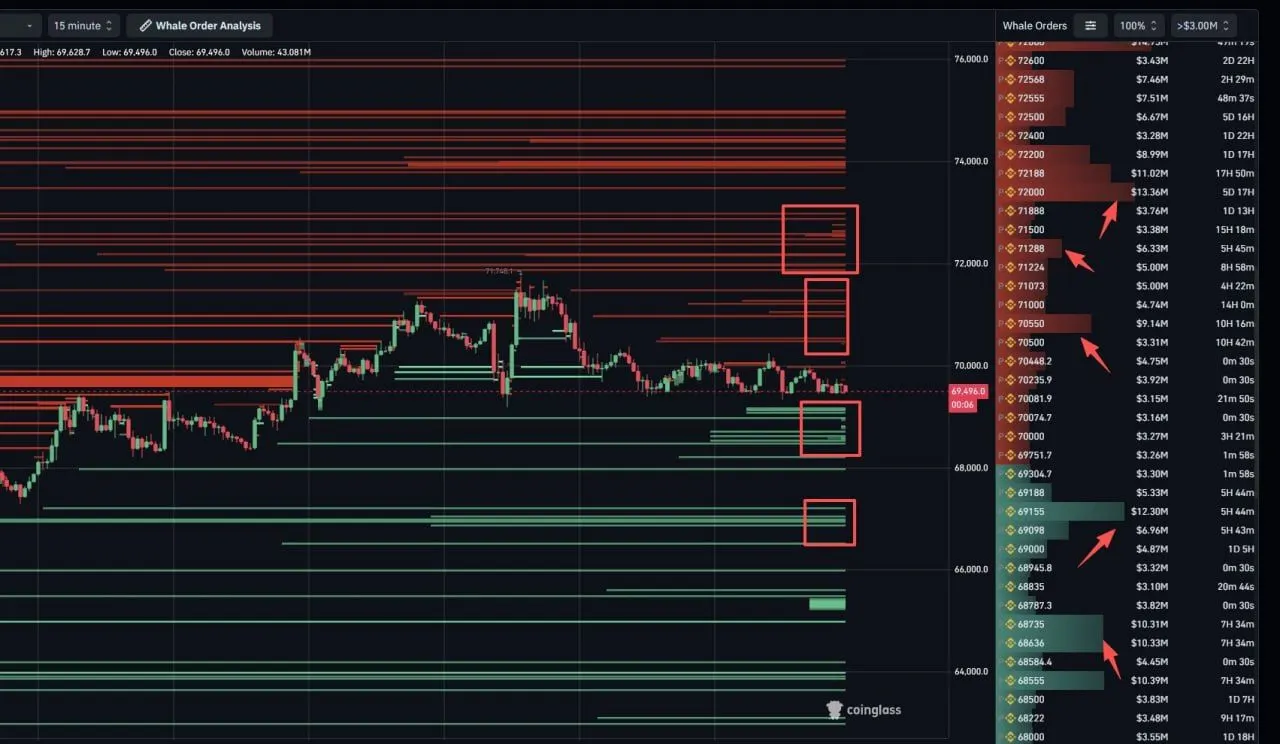
Bitcoin Whale Order Analysis. Source: CoinGlass
The chart depicts persistent sell walls just above current levels—particularly near low-$71K—and again closer to ranges of $72K-$72K500. Simultaneously several bid clusters rest below at approximately $69K with additional deeper support forming near $68K700; thus leaving Bitcoin confined between nearby resistance and supportive forces created by larger market players.
Sitting nearer to this lower half of its range appears slightly bearish unless buyers can reclaim strength in upper liquid zones; should Bitcoin breach below its crucial$69k support area next moves may rapidly extend into deeper buying territories since gaps in available liquefaction typically enable quicker shifts in pricing dynamics . Conversely ,if buyers manage absorb selling pressure pushing past 71k-72k500 then stronger momentum signals would emerge paving way aggressive upside expansion .
In essence ,the data indicates an awaiting resolution state ;as long bitcoin remains trapped within these defined whale parameters fluctuations may persist however upon breaking free concentration orders on both sides imply forthcoming move will likely be swift directional .