
Bitcoin is climbing toward a key resistance zone around $69,150. If the price fails to break through, the move may turn into a bull‑trap and set the stage for a slide back to the $56,000‑$58,000 support corridor.
The leading cryptocurrency is now testing the upper edge of a descending channel that has repeatedly halted upward thrusts. This barrier has acted as a reliable rejection point in several past attempts.
Although the recent surge looks optimistic on a short‑term basis, the overall chart pattern hints that sellers could still dominate if the resistance holds firm.
Key technical observations
• Resistance level: The descending channel caps near $69,150.
• Recent high: A brief breach above the range was quickly erased when price slipped back inside the channel.
• downside target: A confirmed bounce off this barrier could drive Bitcoin toward the $56,000‑$58,000 zone.
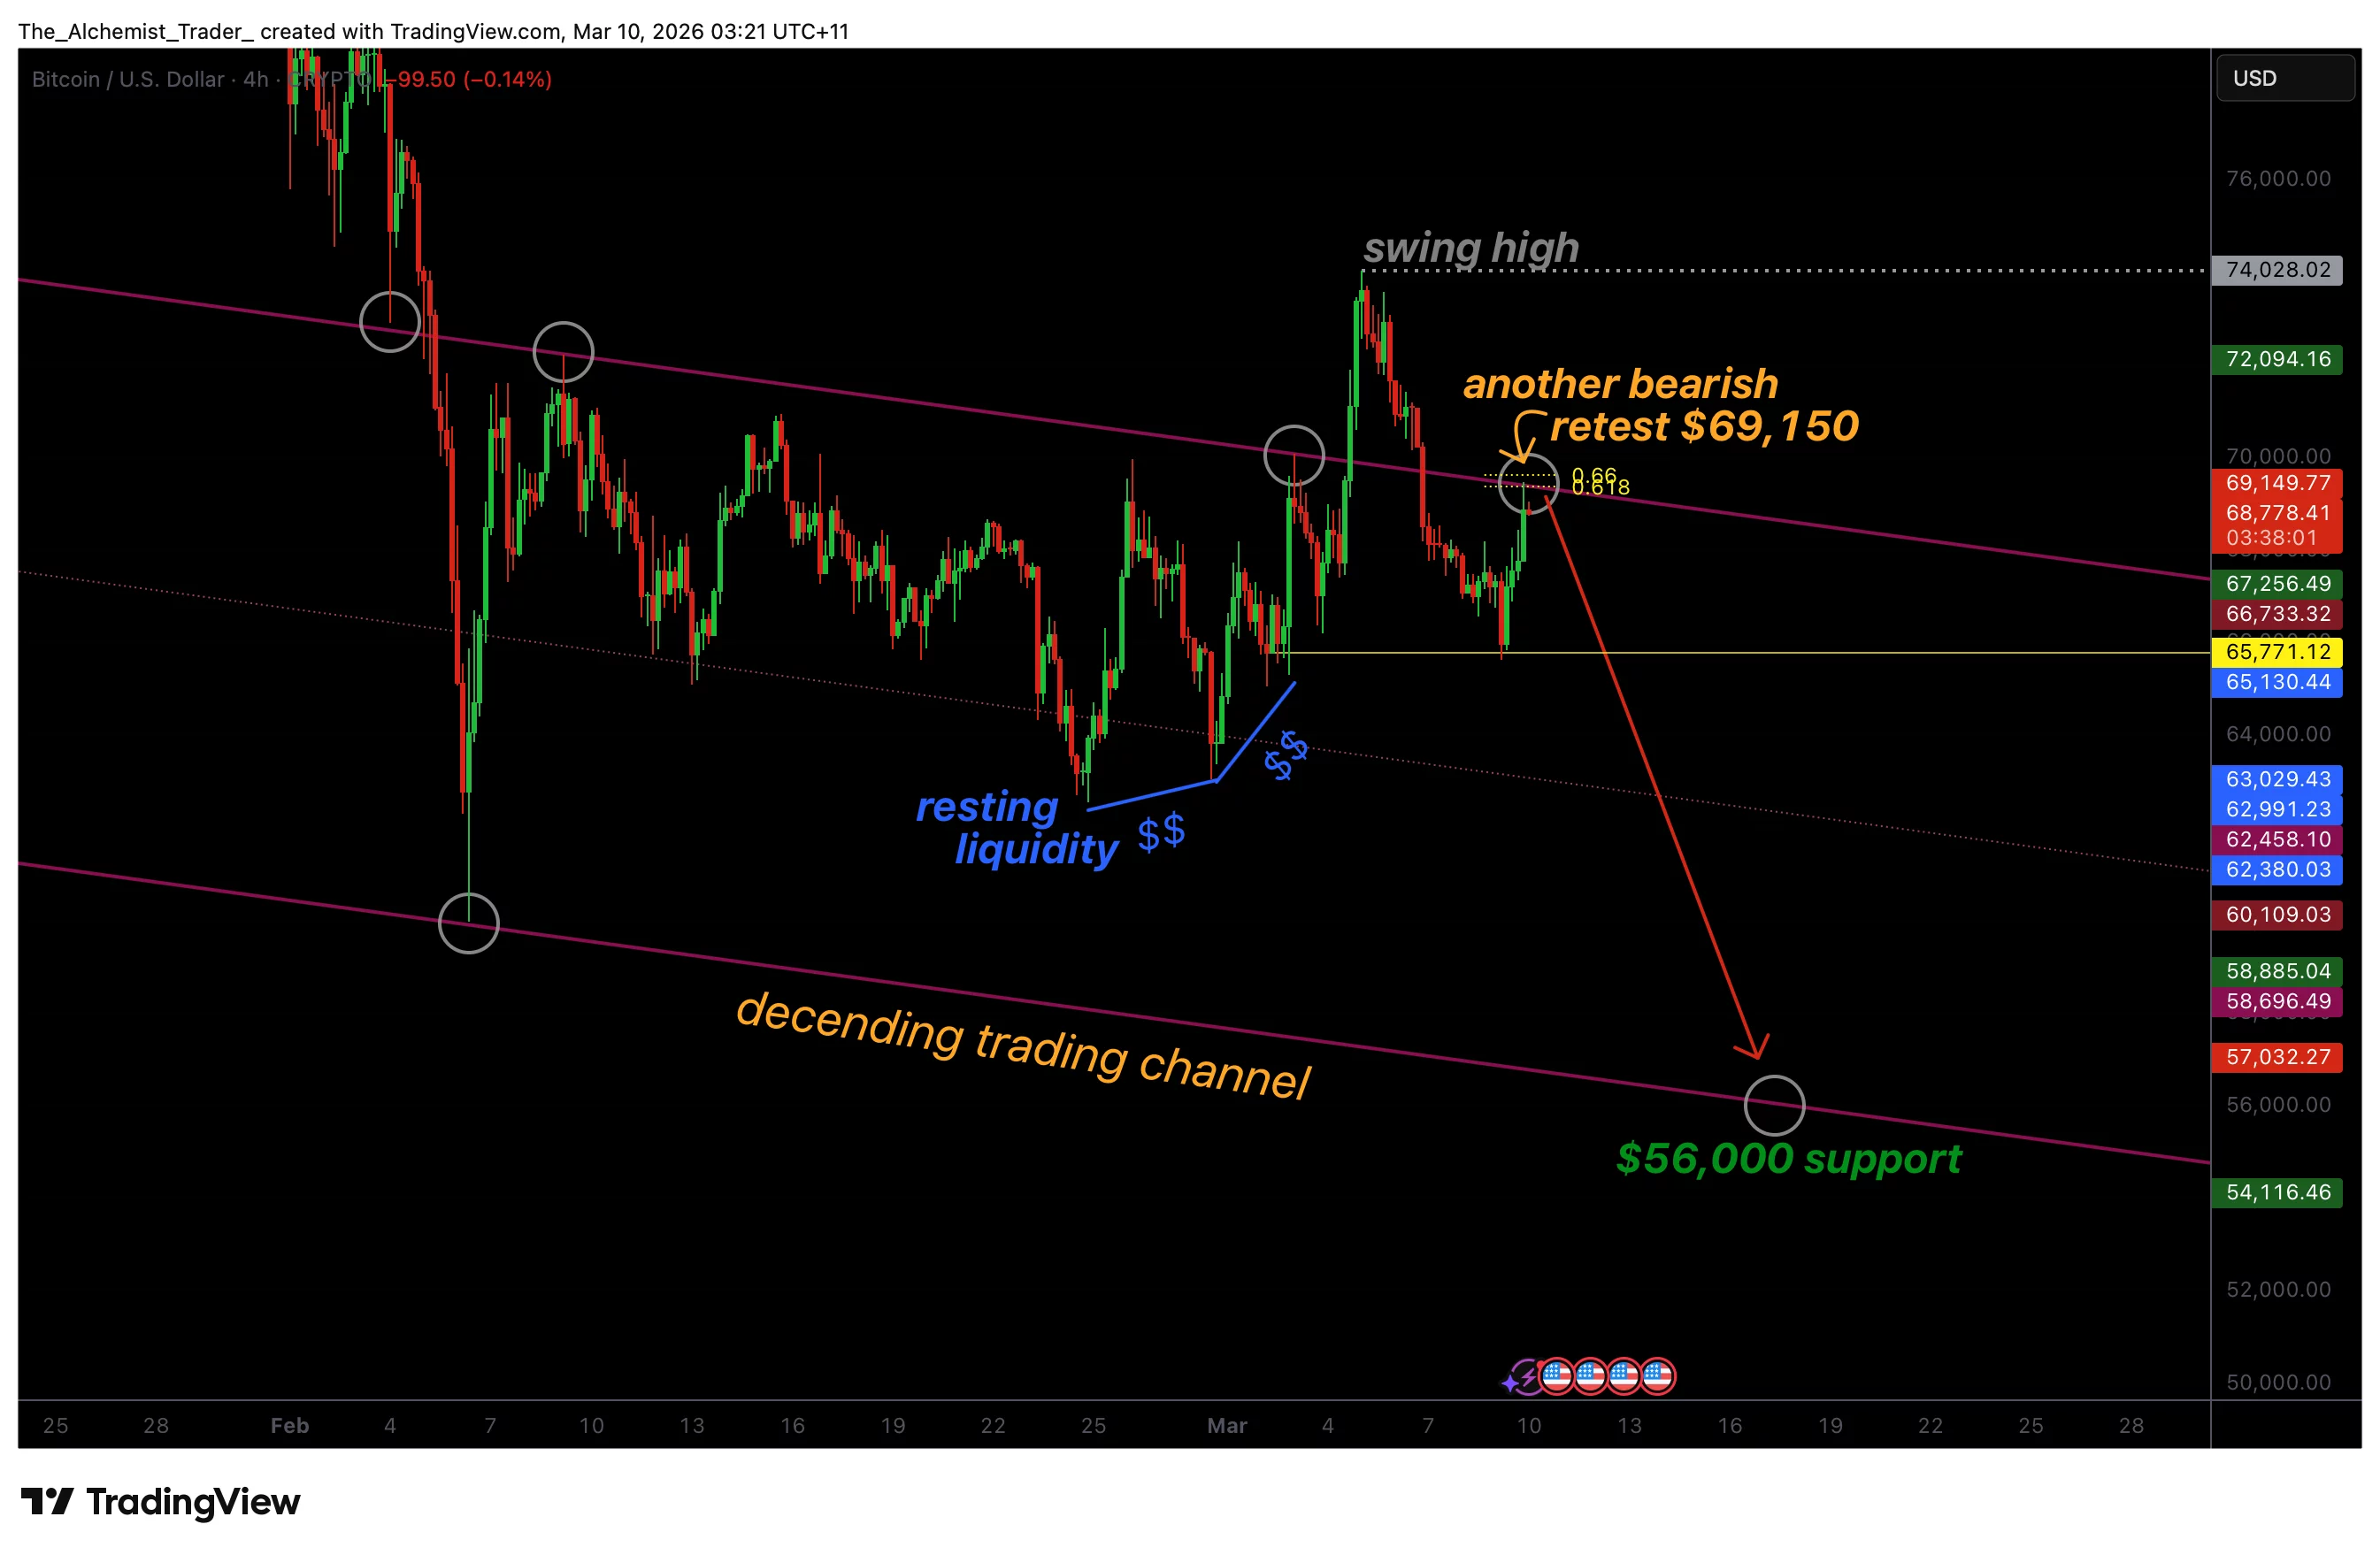
The current uptrend has nudged Bitcoin back to a pivotal resistance line that has defined the channel for weeks. Each time the market approaches this line, profit‑taking and sell orders tend to surface, preventing a clean breakout.
The latest swing high initially seemed to confirm bullish momentum, yet the swift retreat into the channel exposed its weakness. In technical jargon this is known as a “range deviation” – a fleeting breach that collapses back into the prior trading range.
Now that price is once again flirting with the $69,150 mark, a bearish retest may be forming. Should sellers defend this level again, the descending channel would be reinforced and a further decline becomes more probable.
Beyond chart patterns, Bitcoin has crossed the milestone of 20 million mined coins, underscoring its scarcity amid ongoing macro volatility, regulatory shifts, and a network increasingly reliant on transaction fees for security.
Liquidity tends to accumulate where stop‑orders and resting orders cluster, often below current prices. Much of this liquidity resides at the lower edge of the channel, built up during earlier consolidation phases.
Because of this imbalance, the odds of a downward correction rise if the upper boundary continues to repel buying pressure. Large participants frequently target these liquidity pockets to execute sizable trades.
External factors add pressure as well; oil prices have surged over 60 % this year amid geopolitical tensions near the Strait of Hormuz, amplifying risk‑off sentiment across asset classes.
The broader market framework remains confined within the descending channel. As long as price stays inside it, moves toward the top are typically viewed as corrective rather than trend‑changing.
Absent a decisive breakout above $69,150, short‑term bias stays neutral‑to‑bearish.
What’s likely next?
Bitcoin sits at a critical juncture. If sellers push it back below the channel’s ceiling, expect a pullback toward the $56,000‑$58,000 support band.
Conversely, a sustained surge past the $69,150 threshold would invalidate the bearish outlook and could reignite bullish momentum.