Bitcoin is currently navigating a broader corrective phase, yet recent price movements indicate some stabilization after successfully defending the $60,000 support level. The daily chart presents a cautious outlook as $BTC remains below significant moving averages and the descending resistance trendline.
This situation places the cryptocurrency at a critical juncture; an upward movement could lead to further recovery towards resistance levels, while any failure would reinforce the ongoing downtrend.
Bitcoin Price Evaluation: Daily Chart Insights
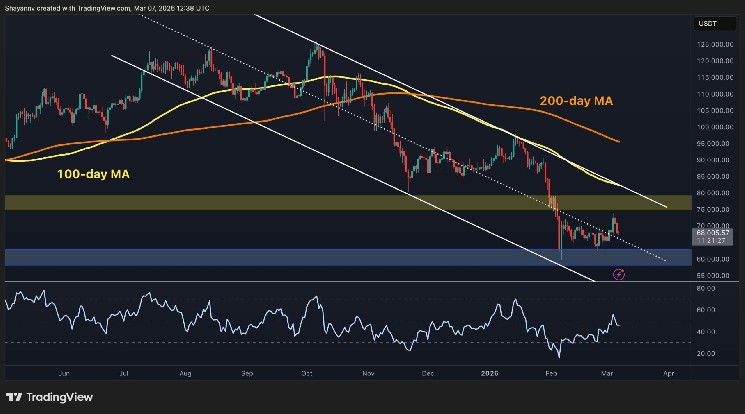
In terms of daily analysis, Bitcoin continues to operate within a clearly defined bearish framework, with prices constrained beneath both the 100-day and 200-day moving averages. The 100-day MA is currently trending downward near the mid-$80,000 range, while the 200-day MA is positioned even higher in the mid-$90,000s—indicating that overall market pressure persists.
Moreover, $BTC remains under a descending trendline that has dictated its correction for several months now. This suggests that buyers have yet to demonstrate a convincing structural reversal in sentiment.
The response from around $60,000 was technically significant; buyers aggressively entered after Bitcoin dipped below this threshold. Since then,$BTC has rebounded toward approximately $68,000. However, major resistance still lies between $76,000 and $80,000—where previous horizontal support has transitioned into supply. As long as Bitcoin trades below this area of resistance, any rebounds are likely to be interpreted as corrective moves rather than genuine reversals.
$BTC/USDT Four-Hour Chart Analysis
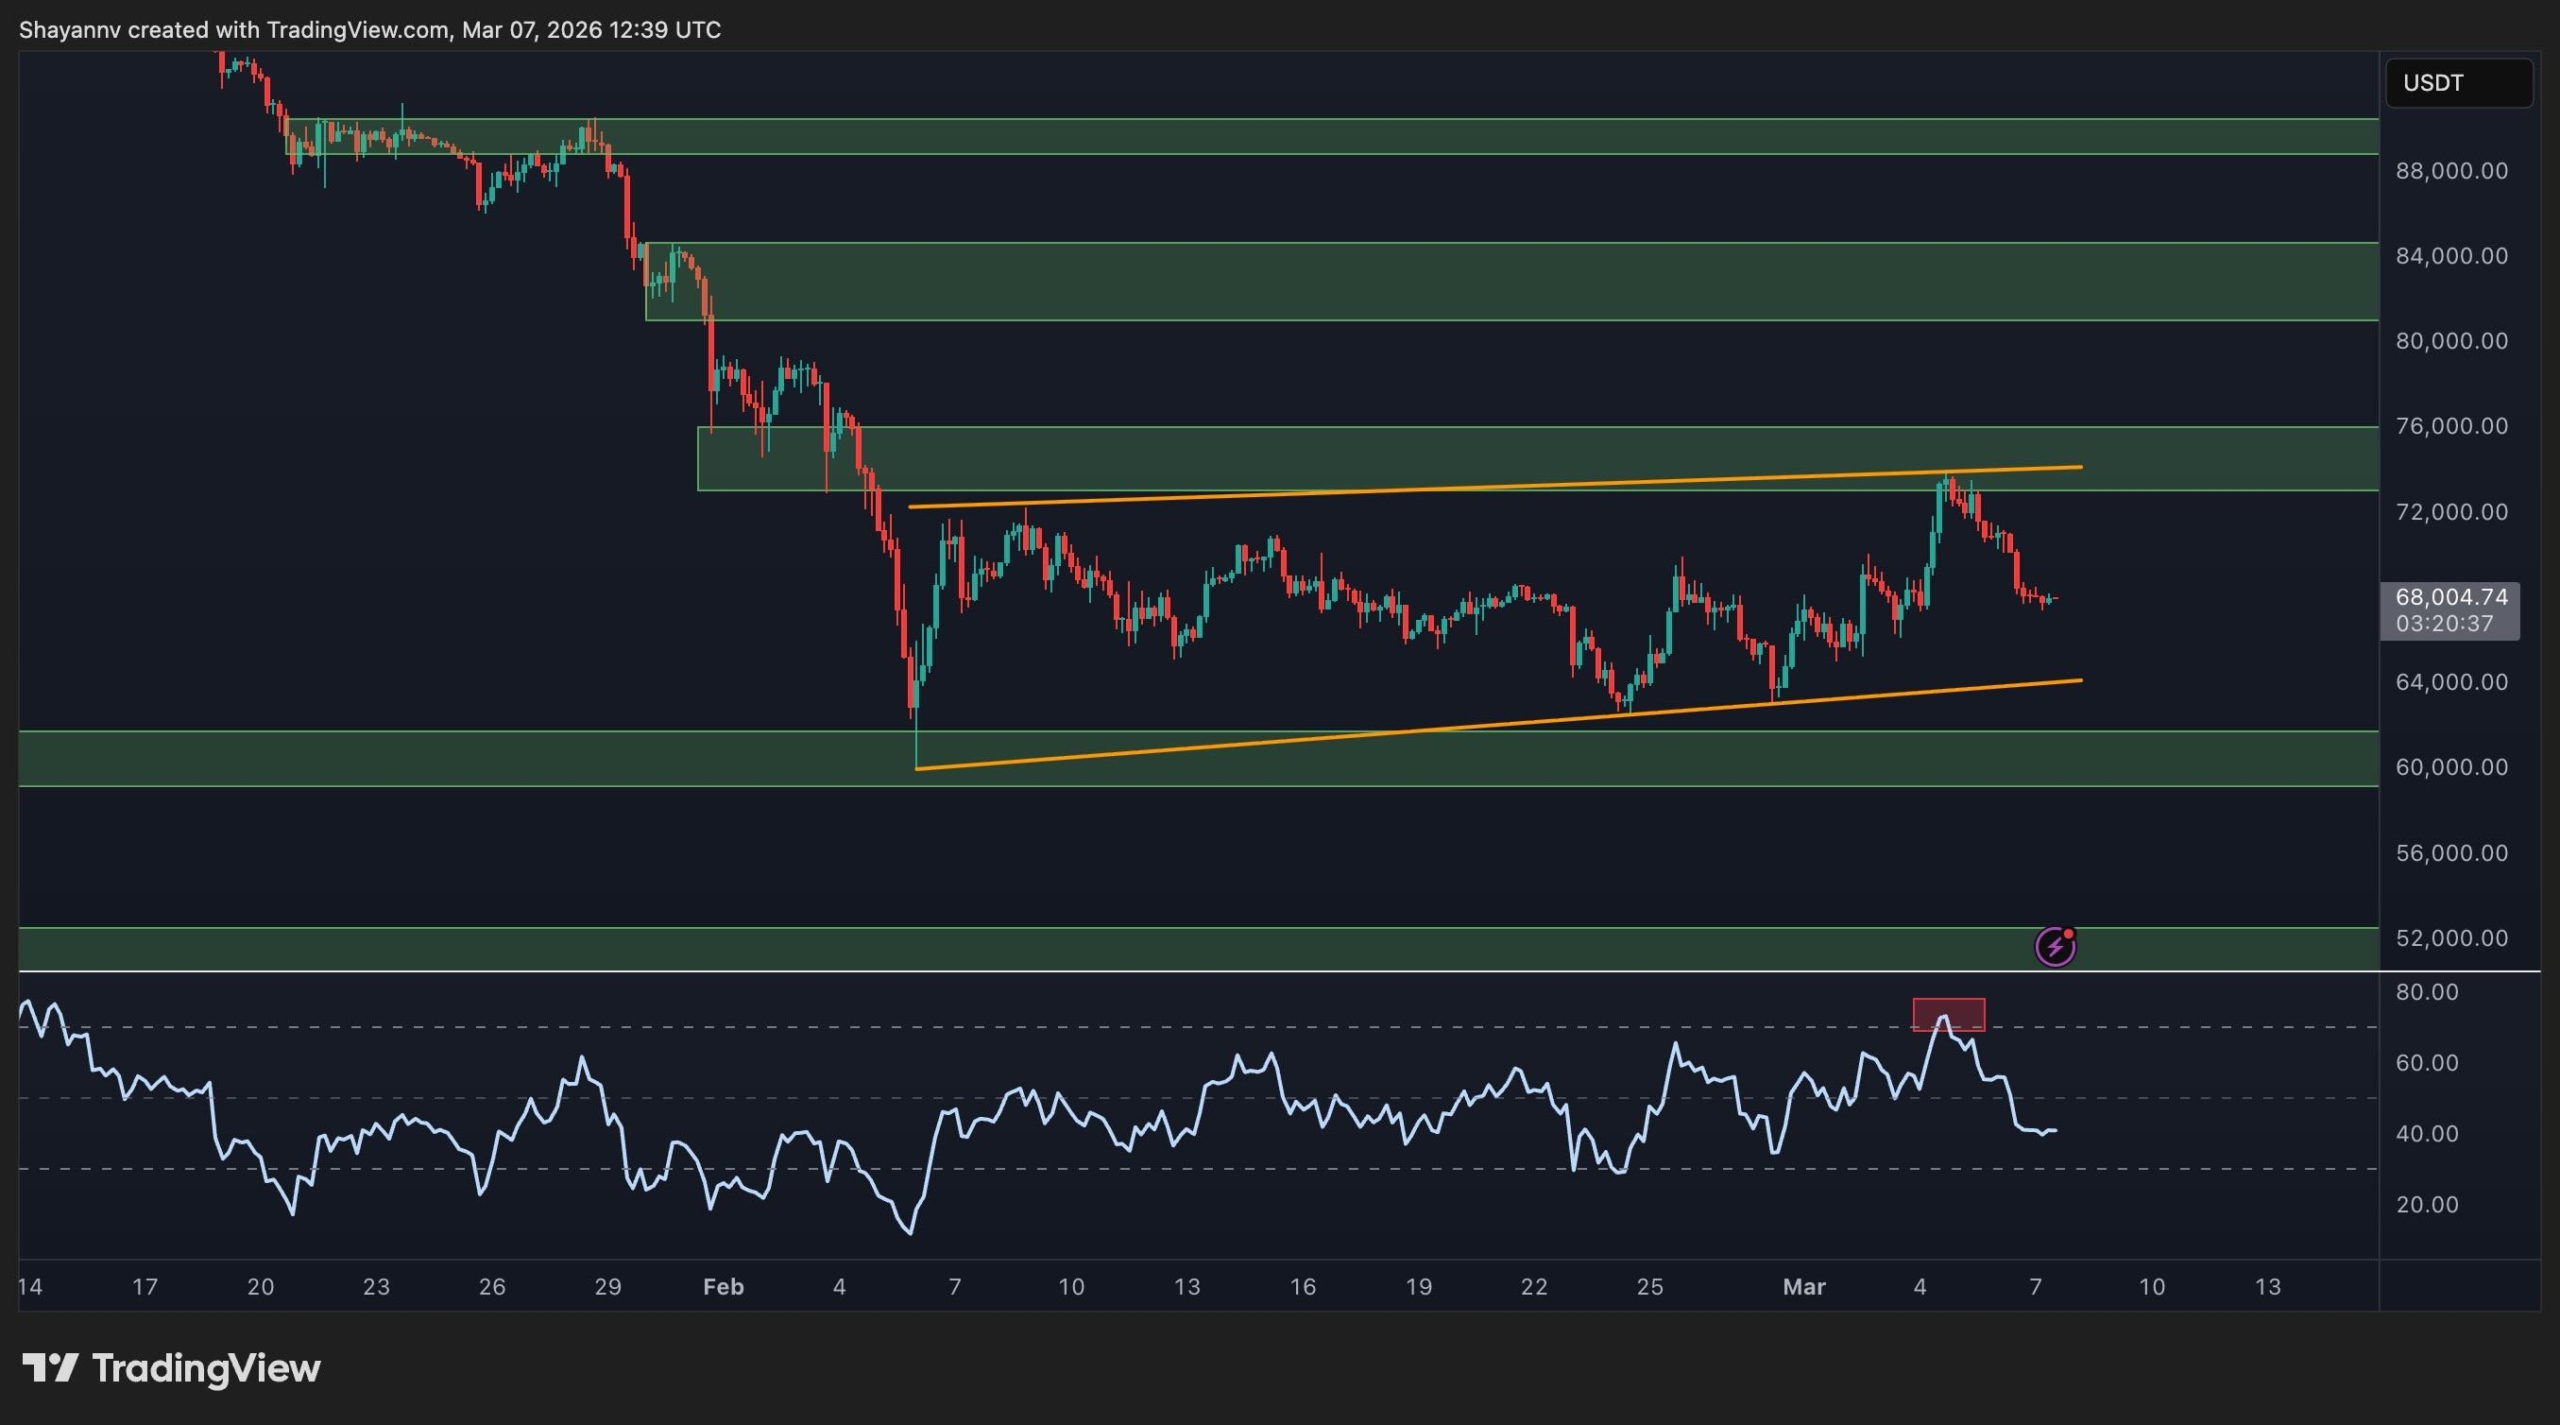
The four-hour chart indicates that Bitcoin is consolidating within an ascending channel pattern; this suggests that its recent recovery from lower levels may represent more of a recuperation phase rather than an outright bullish reversal. Currently trading around $68,000 after facing rejection near the upper boundary of this channel (approximately between $72K and $75K), it appears sellers remain active during rallies—especially when $BTC approaches areas where channel top meets horizontal supply zones.
Momentum indicators have also noticeably weakened recently. Although RSI reached overbought territory during earlier gains before retreating back toward neutral levels—indicating diminishing upward strength in short-term trends.
If buyers can maintain positions above mid-channel areas while defending regions around $64K to $65K effectively—that would keep prospects for another upward attempt alive. Conversely though—a breakdown through lower boundaries could see Bitcoin revisiting support zones near or even beneath$60K level again soon thereafter!
An Examination of On-Chain Metrics
An on-chain perspective reveals significant shifts: Bitcoin’s Net Unrealized Profit and Loss (NUPL) metric has plummeted sharply downwards—to about 0.20—which marks substantial resetting compared with euphoric highs experienced earlier during market surges leading up cycles’ peaks!
This essentially means much speculative excess has been flushed out from markets—and typically reflects reduced speculative behavior overall! While such conditions don’t guarantee immediate trend reversals—they often pave healthier foundations compared against overheated environments observed at major tops previously seen historically speaking!
NUPL readings hovering close towards these figures suggest we’re transitioning away from euphoria instead approaching sentiments conducive for medium-term base building efforts ahead! This aligns well alongside current pricing structures wherein stabilization occurs post-correction phases rather than rushing into fresh expansions prematurely just yet…
The implication here being on-chain data hints downside risks appear limited relative towards prior high points—but solidifying stronger bullish narratives will require confirmation via reclaiming higher resistances across both daily & four-hour charts alike going forward…
