
Summary
Bitcoin is currently priced at $68,512 after facing resistance near the $70,000 mark.
A death cross has formed on the three-day chart for the first time since 2022.
Short-term indicators suggest that selling pressure is easing despite a bearish long-term outlook.
The cryptocurrency Bitcoin is undergoing a significant technical challenge at the $70,000 threshold as of March 3, 2026. Currently trading at $68,512, it reached an intraday high of $69,510 and dipped to a low of $66,326. This price point has encountered resistance near the psychologically important level of $70,000 for the third consecutive time in recent weeks.
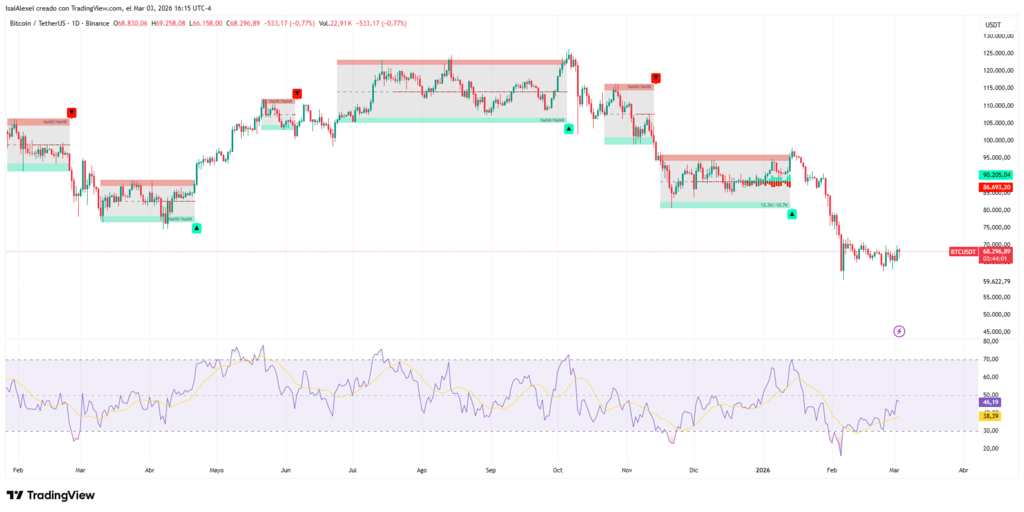
Sellers emerged around the price point of $69,500 during this session; however, buyers managed to uphold support at approximately $67,800. The current market activity indicates a direct conflict between those anticipating further upward movement and those expecting a more substantial correction. The daily Relative Strength Index (RSI) stands neutral at 46 with a slight bullish inclination while MACD remains negative without signaling any trend reversal yet.
Technical Indicators: Short vs Long-Term
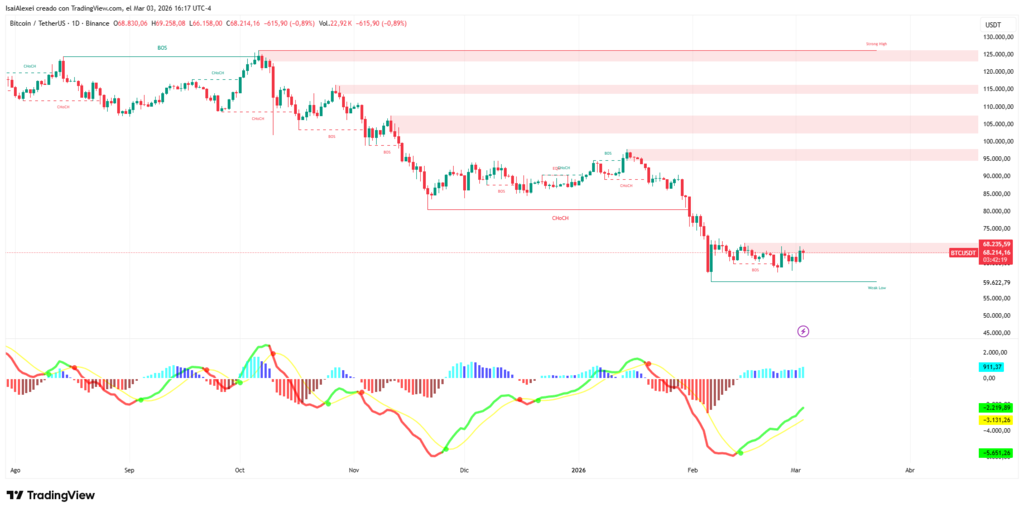
The three-day chart reveals that for the first time since last year there’s been a death cross where the 50-period moving average has crossed below its 200-period counterpart—a pattern historically linked to corrections as severe as 35%. This development raises caution among traders who are closely monitoring key support levels set at both $65,000 and $62,500. A breach below these levels could trigger accelerated selling towards reaching around$60K.
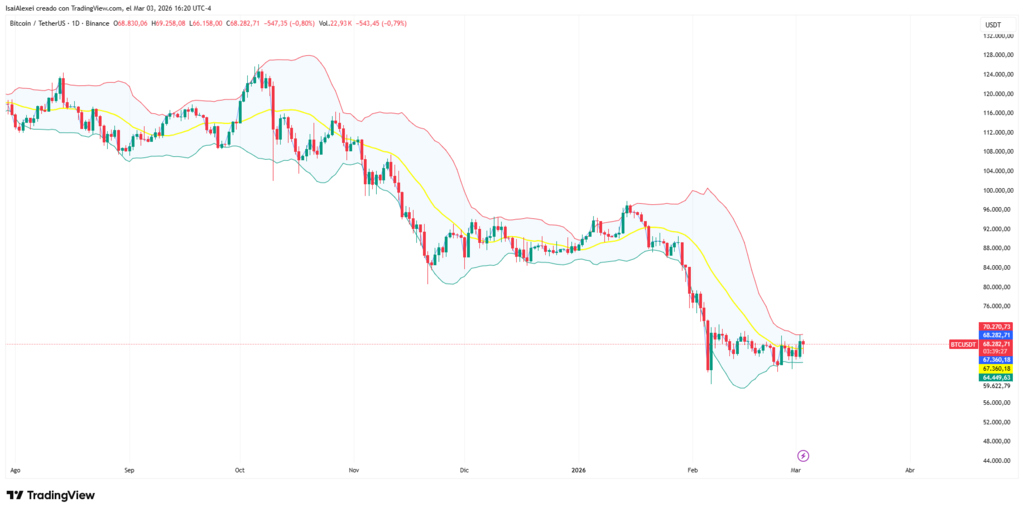
Nevertheless, short-term indicators present contrasting signals against this bearish backdrop. Bitcoin has regained its position above its 20-day moving average while Bollinger Bands are narrowing—often indicating impending sharp price movements ahead. According to research firm 10x Research, selling pressure appears to be diminishing with hourly RSI indicating recovery potential. Analyst Michaël van de Poppe suggests that consolidation above $65K would generate momentum conducive for an upward breakout.
That’s exactly what I was looking for from these markets.
Quick turnaround upwards on BTC.
Massive.
It’s actually outperforming all assets today (except oil). pic.twitter.com/4nz10YSyr5
– Michaël van de Poppe (@CryptoMichNL) March 3rd ,2026
Critical Levels Shaping Immediate Outlook
Resistance lies primarily between$70Kand$72K.Adaily close exceeding this range coupled with increased volume would pave way towards reaching$76K.On downside,$66k serves as immediate critical support.Adrop beneath it would prompt testing initially around$65kfollowed by subsequent examination near$62k .
OnMarch2nd ,USspotBitcoinETFsrecordedinflowsamountingto$458millionindicatinginstitutionaldemandondips.Conversely,minercoreScientificannouncedthesaleofmostofitsBitcoinholdings tofuelitsartificialintelligenceexpansion—a decision likelytoincreaseavailablemarket supply.
Bitcoinhasnowexperiencedfiveconsecutivemonthlydeclines,a phenomenononlyobservedduringthe2018-2019bearmarket.Duringthatperiod,thisnegative streakwasfollowedby300%reboundoverthenextfive months.
Theuncertainty remains whetherrecentbottomaround$65krepresentsatruefloororifadditionalcorrectionisneededbeforebuyersenter.Theoutcomeofthetestat$70kwilldeterminefuturedirectioninthecomingweeks.