The recent surge in Bitcoin’s price is nearing a significant resistance area, leading to worries that this upward movement might turn out to be a bull trap.
Overview
Price testing the upper channel and Fibonacci resistance levels.
Decreasing volume indicates weakening bullish momentum.
The risk of rejection could lead to a decline towards the $60,000 support level.
Bitcoin ($BTC) has experienced a notable rebound from its recent lows around $60,000, pushing it back toward the upper limits of its broader trading range. While this rally has bolstered short-term market sentiment, technical indicators suggest that caution is warranted.
A multitude of resistance levels now exists above the current price point, creating an environment where further upward movement may struggle to maintain momentum.
Key Technical Insights for Bitcoin Price
- Channel Resistance: The price is nearing the upper boundary of its established trading channel.
- Fibonacci Confluence: Resistance overhead coincides with significant swing highs and moving averages.
- Volume Concerns: A decrease in trading activity suggests potential formation of a bull trap.
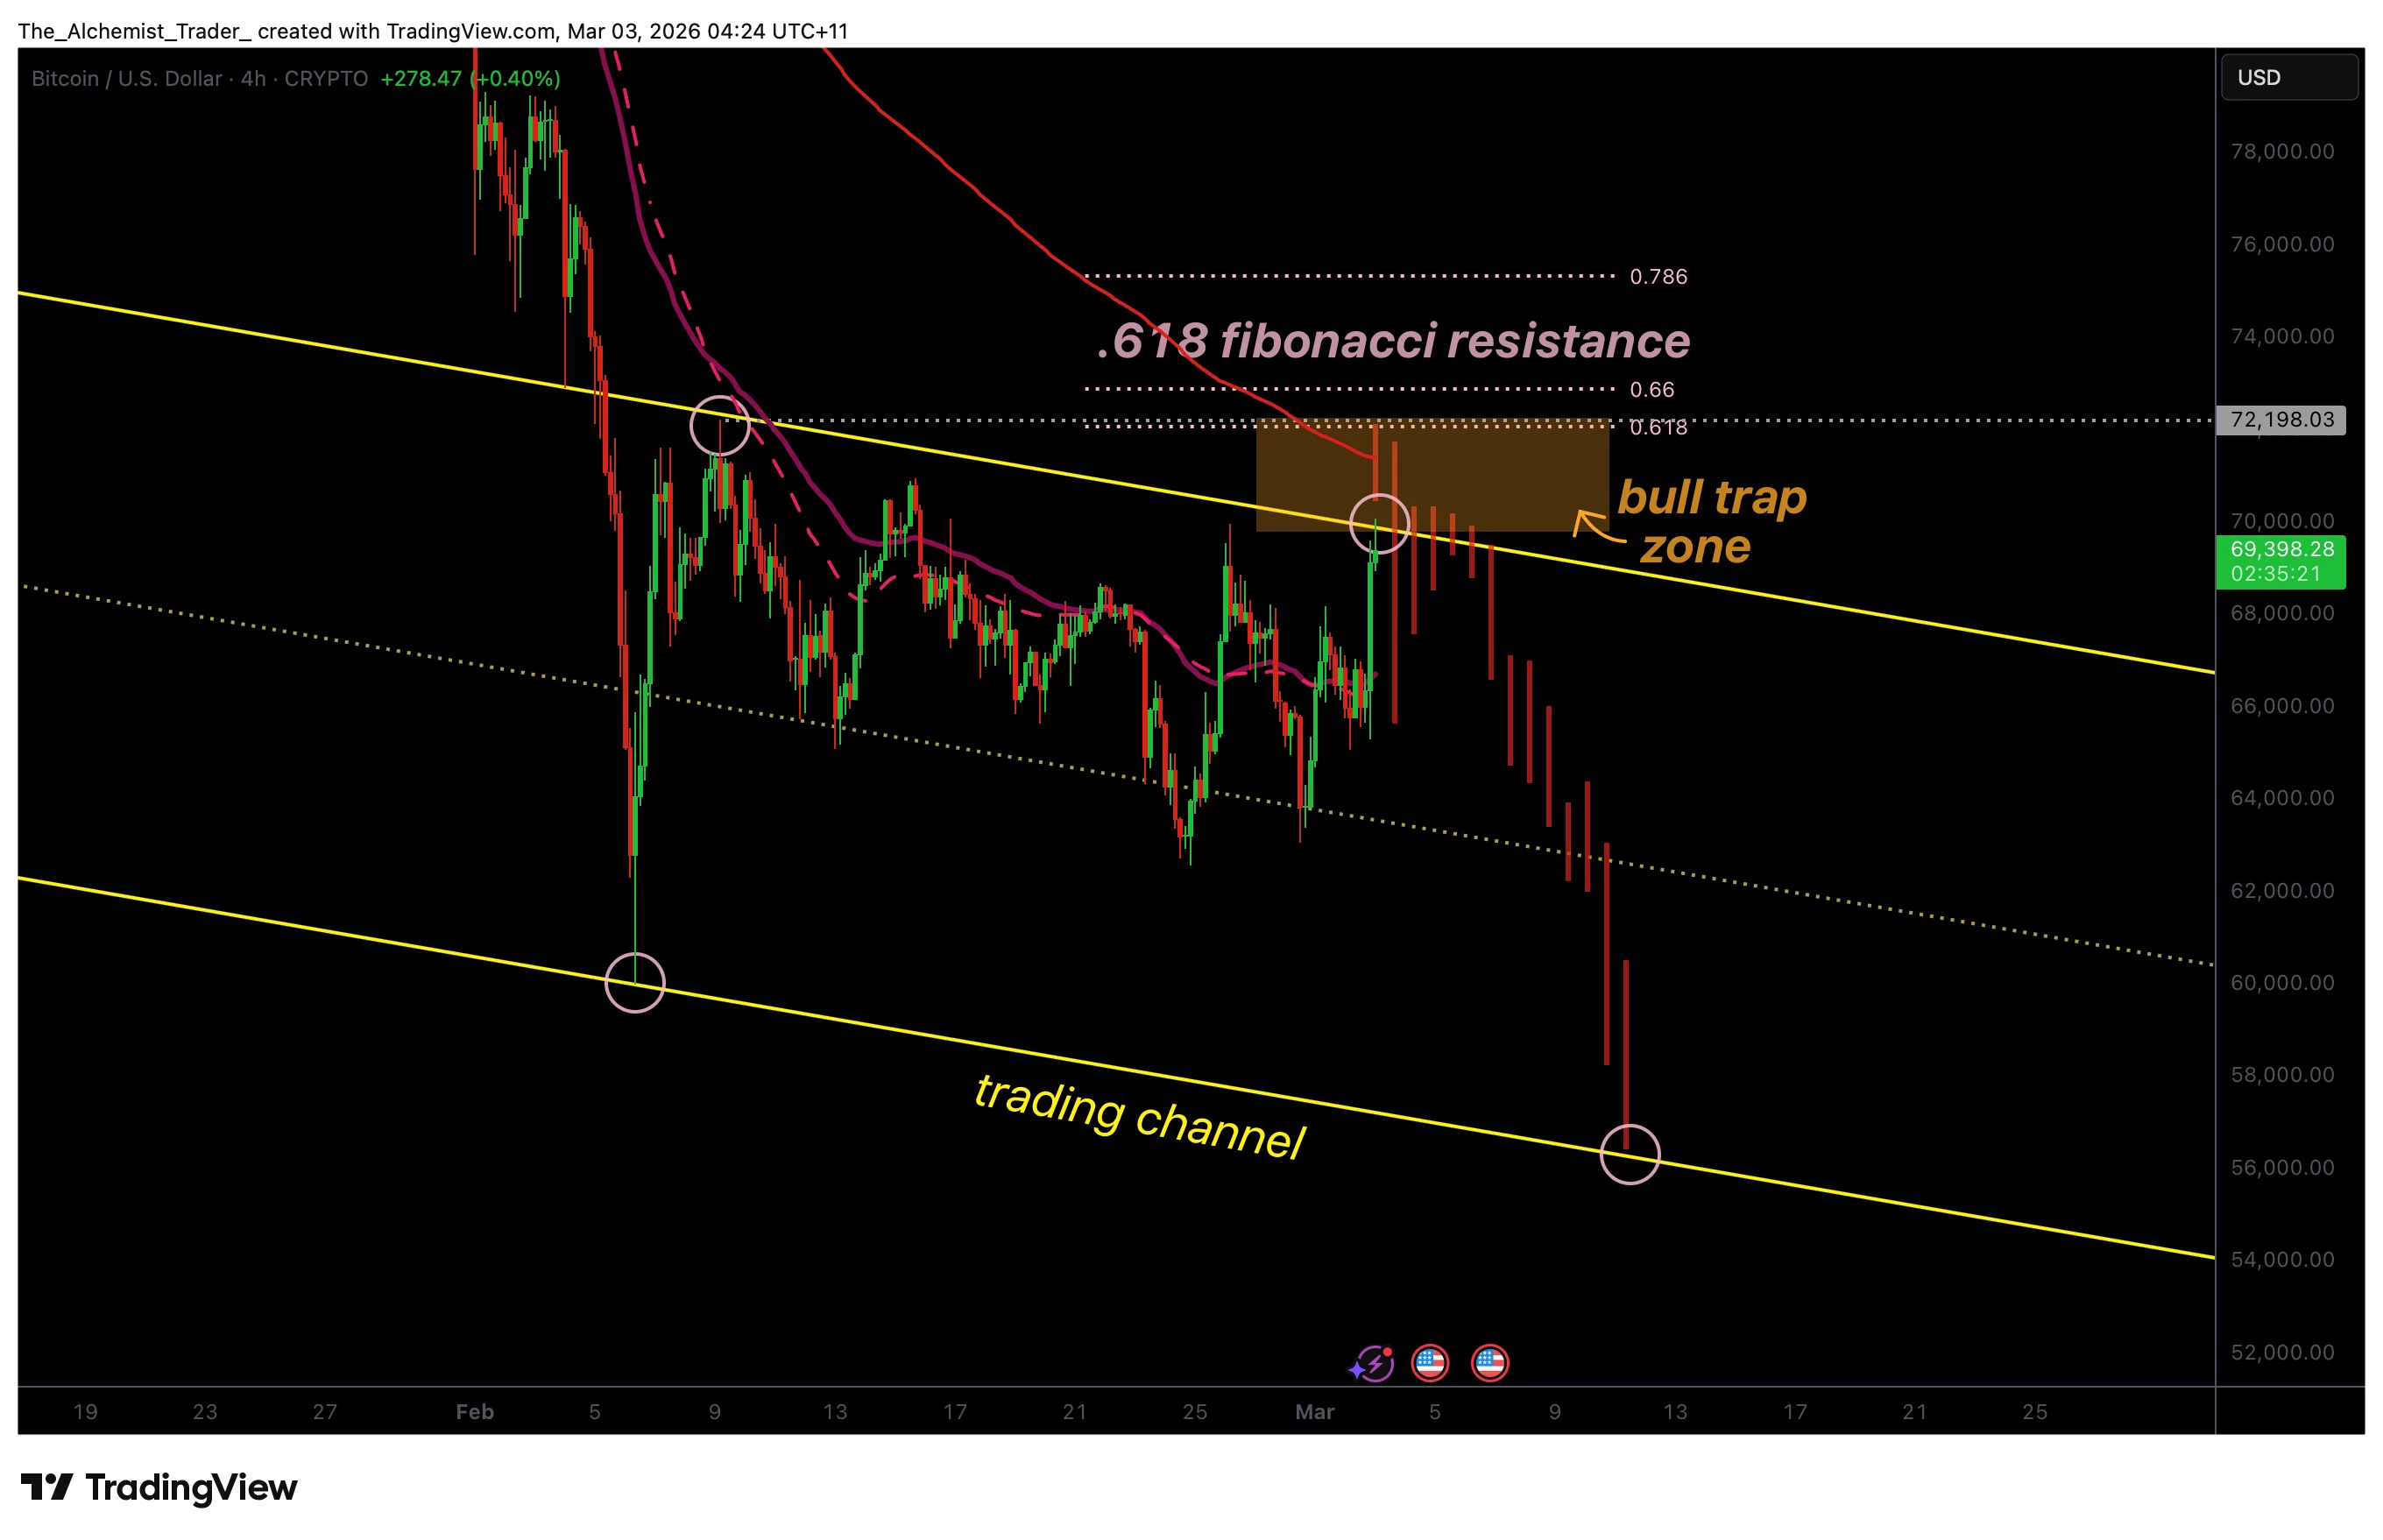
The latest rally in Bitcoin’s price has pushed it above the midpoint of its trading channel, indicating short-term strength within this broader range. However, it is now approaching the upper boundary—an area that has consistently limited upside since establishing $60,000 as last week’s low. This point serves as an essential structural ceiling during this consolidation phase.
You might also find interesting: This article discusses how investors are generating income amid expanding adoption for $XRP.
An additional layer of resistance comes from significant Fibonacci retracement levels overlapping with previous swing highs and descending moving average resistances. When various technical indicators converge within a tight pricing zone like this one, markets often respond strongly; thus increasing chances for rejection rather than continued breakout action due to overlapping resistances enhances these probabilities further.
The dynamics surrounding volume also reinforce cautionary sentiments. Despite appearing strong at first glance during this rally phase—the actual trading volume has been steadily declining as prices approach key resistances typically required for confirming healthy breakouts through increased participation signals strength effectively when present; however fading volumes indicate weakening buying pressure—a classic sign preceding potential bull traps especially considering approximately 46% percent supply currently held at losses reminiscent from prior bear market conditions seen back in 2022!
A typical scenario involving such traps occurs when prices momentarily breach above established resistances enticing breakout buyers only then reverse sharply closing below critical thresholds instead should bitcoin fail holding onto those highs falling back into earlier ranges—it would signify weakness confirming setup along bearish trends likely shifting overall downward momentum thereafter!
You might also find interesting: This article explores why crypto markets are experiencing gains today (March 2).
If rejection transpires here next logical destination would be lower boundaries set forth by channels since they haven’t been retested after forming weekly lows around sixty thousand dollars—markets frequently revisit untested supports balancing liquidity before determining future directions ahead!
Taking into account broader market structures remains evident BTC stays trapped within ranges lacking confirmed bullish expansions unless decisive breakouts occur supported robustly through volumes rallies against resisted zones carry heightened failure risks associated!
The combination formed by fibs alongside moving averages coupled with structural ceilings reinforces arguments suggesting limitations on upsides persistently loom near term particularly amidst defensive liquidity environments triggered via escalating US-Iran tensions plus wider volatility across markets overall!
Your Expectations Regarding Upcoming Price Movements?
Bullish movements remain susceptible while testing confluences marked by decreasing volumes any rejections emerging from these areas will validate possible formations indicating corrective shifts reverting towards support near sixty thousand dollars.
Only substantial breakouts backed firmly via voluminous confirmations would decisively alter outlooks turning them favorably bullish henceforth!
You can read more about whether $XRP‘s value will bounce back following Brad Garlinghouse’s prediction regarding ten trillion flowing into XRPL?.