Bitcoin is currently valued at $69,397, boasting a market cap of approximately $1.40 trillion and experiencing a 24-hour trading volume of $42.58 billion. Within the last day, its price fluctuated narrowly between $69,286 and $70,897, indicating an active and liquid market where traders are cautiously positioning themselves.
Technical Analysis of Bitcoin
At this juncture, Bitcoin finds itself at a critical technical point just below a well-established resistance zone as momentum attempts to stabilize price movements. Although the overall trend remains corrective within a larger downtrend framework, shorter time frames show emerging bullish tendencies pushing against an important inflection level that could determine whether consolidation leads to continuation or reverts back into weakness.
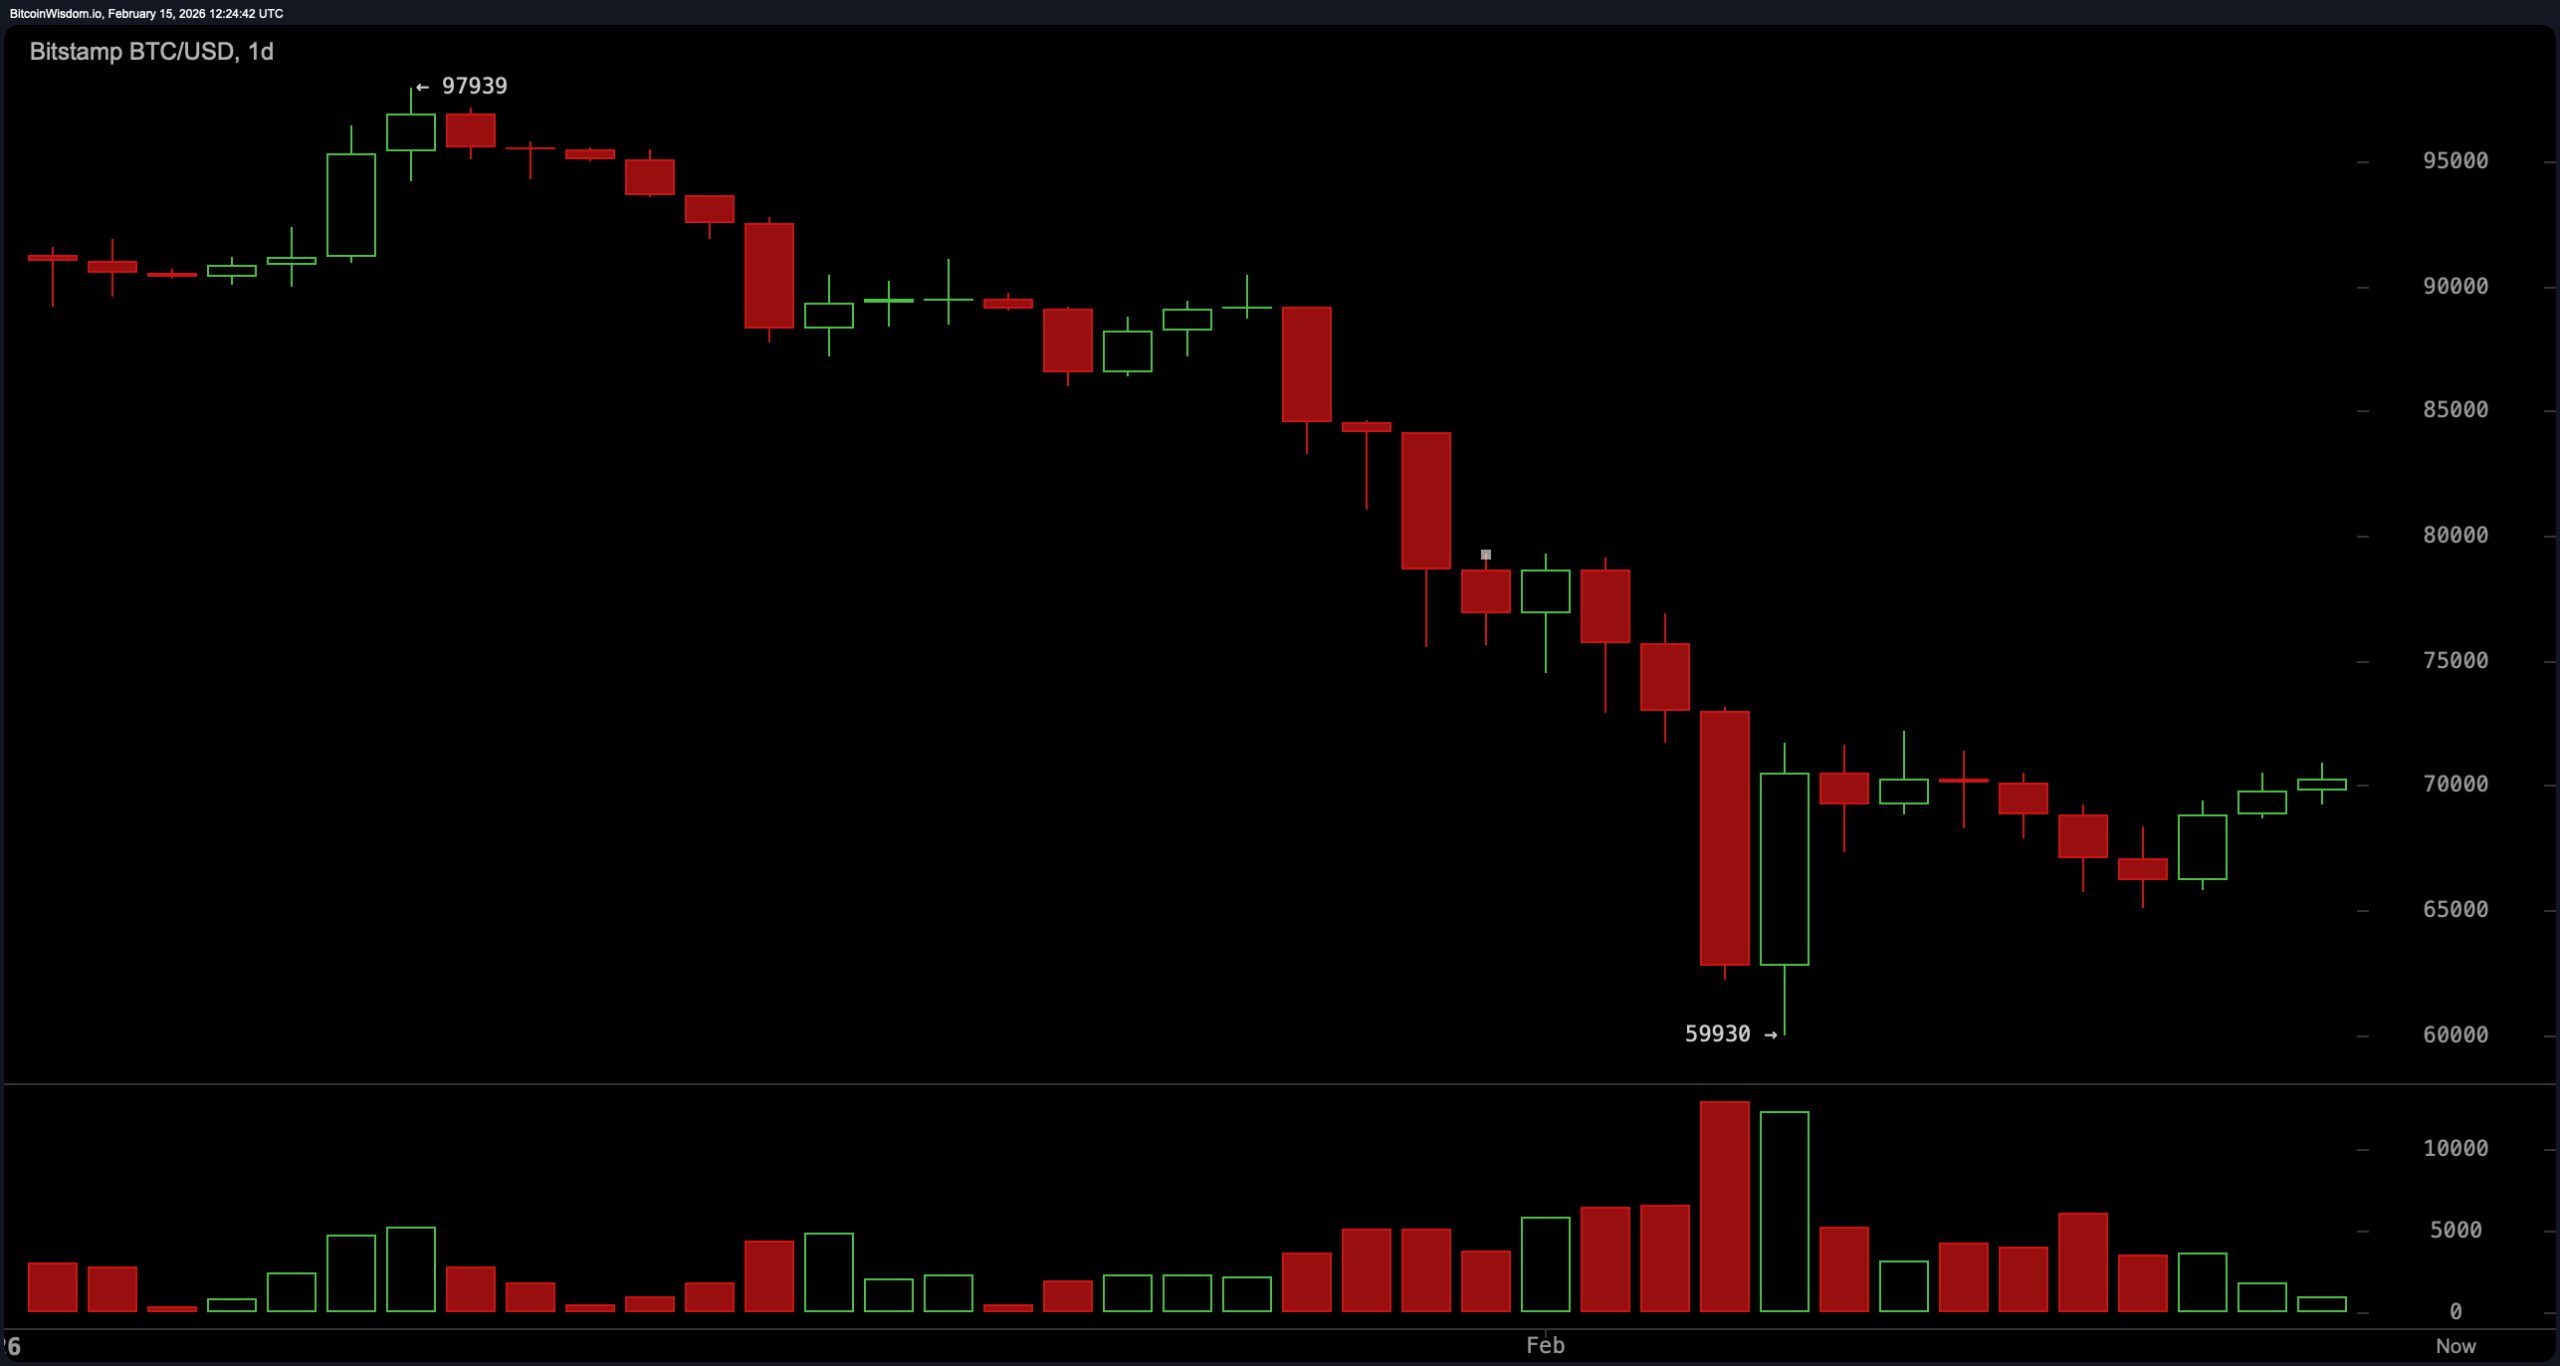
The daily chart reveals Bitcoin undergoing a relief rally amid dominant bearish conditions. After reaching an all-time high near $97,900 earlier this year followed by a sharp decline to around $59,930, it has since rebounded into the range between $70,000 and $71,000. Despite this bounce back upwards lower highs persist and price action consolidates beneath the key resistance at roughly $72,000. Resistance levels are clearly marked at approximately $72K,$75K,and$80K; meanwhile support zones lie near$65Kand$60K—the latter being crucial structural pivot point whose breach would confirm continuation of the prevailing downtrend.
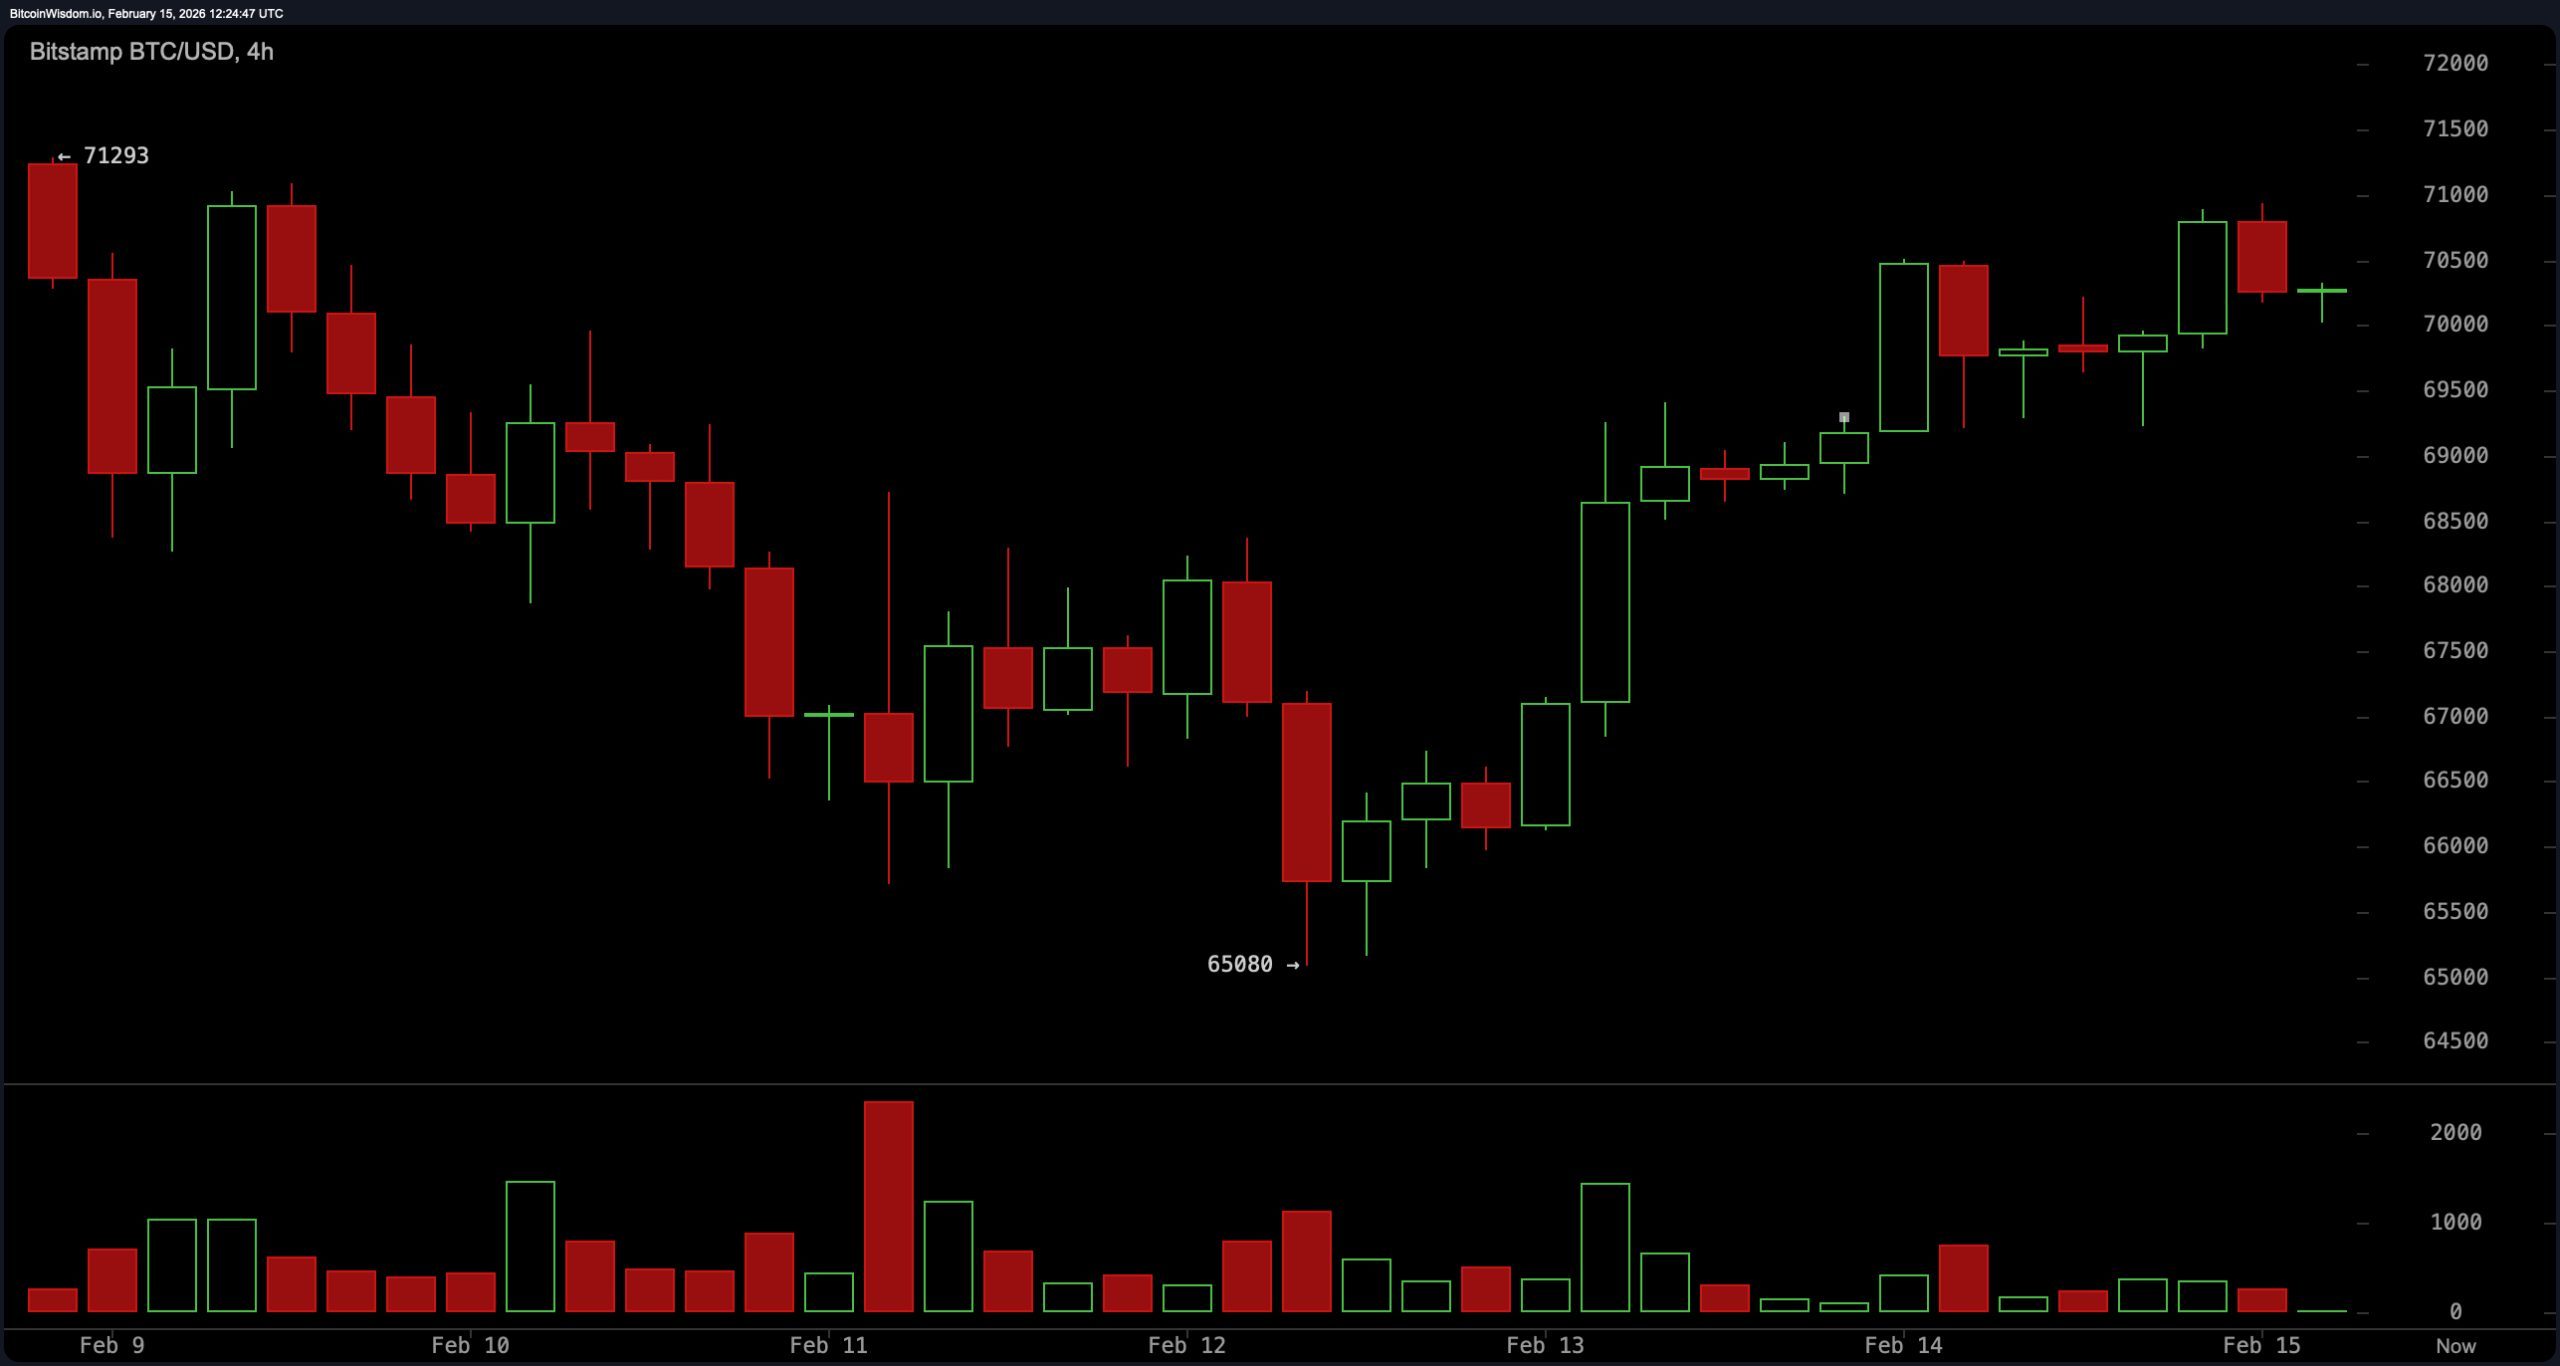
The four-hour timeframe offers more detail: after forming a higher low around$65, 080,a series of higher highs pushed prices toward the upper boundary near$71, 000.Establishing short-term bullish momentum within the broader daily downtrend.
Currently,BTC faces resistance in the breakout zone between approximately$71, 500and72, 000.A decisive close above this level on four-hour candles would open room for gains targeting around$75, 000.Without such confirmation,rejection here raises chances for retracement toward support near68, 000.Failure there shifts focus back toward strong support close to65, 000.This pattern reflects classic compression under resistance where hesitation often results in pullbacks rather than breakouts.
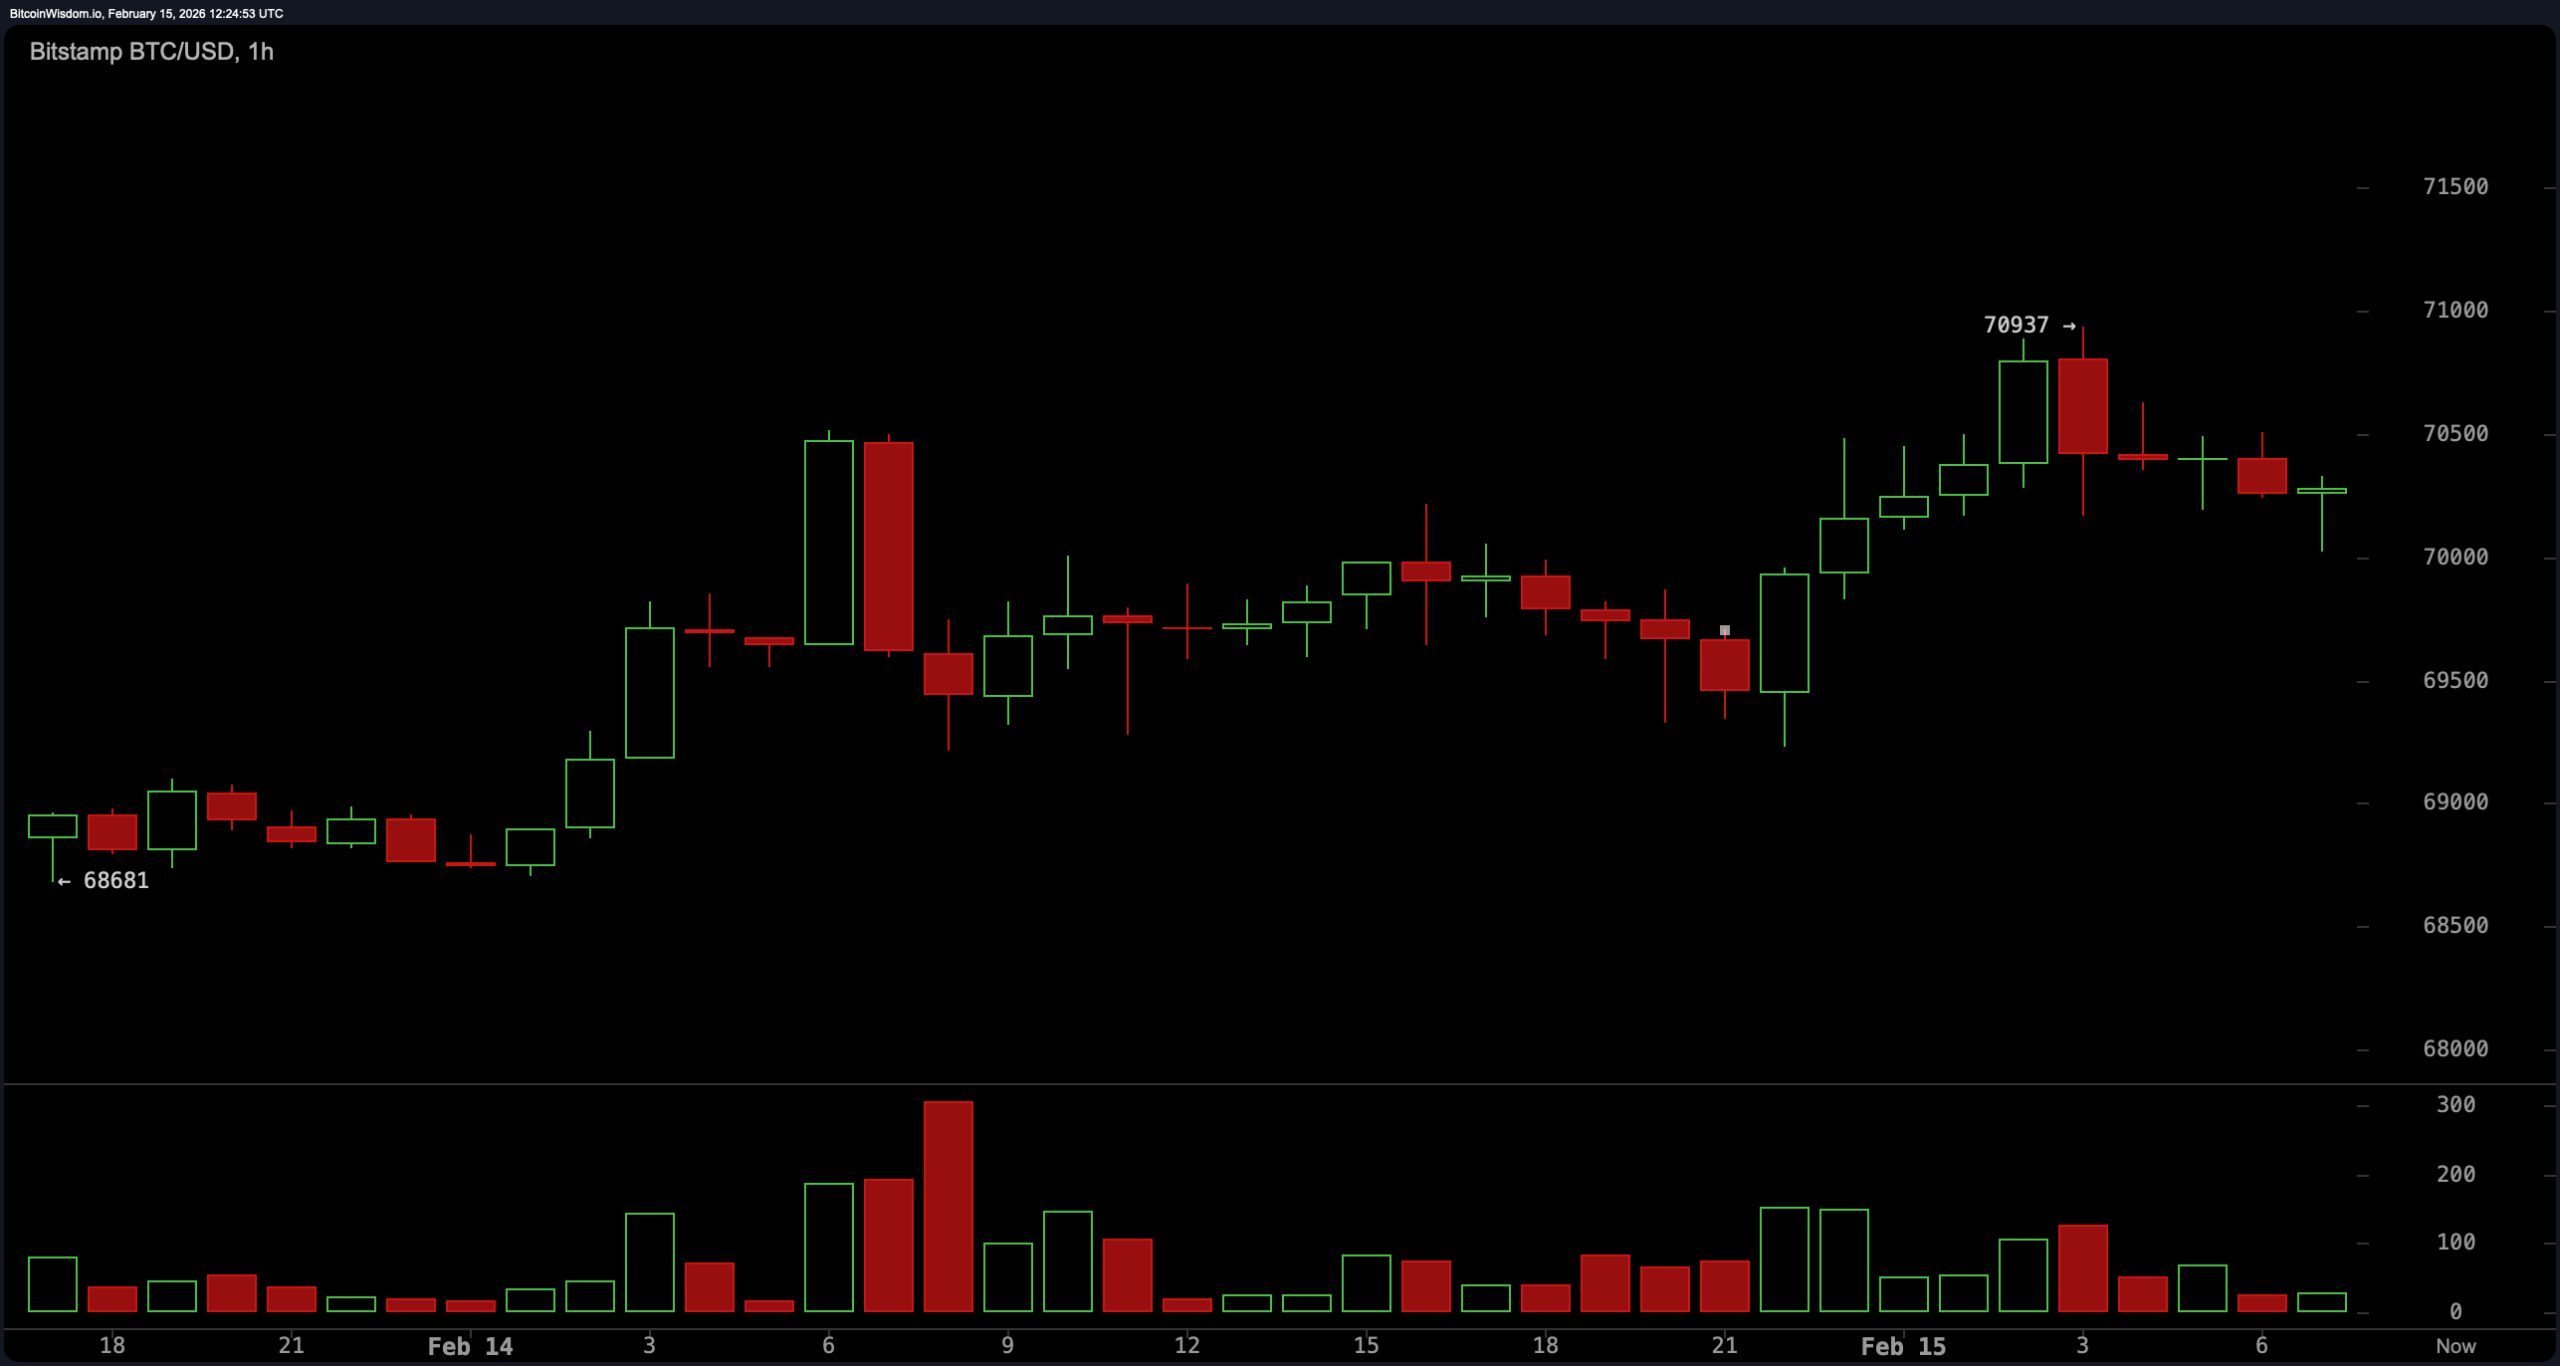
Zooming further into one-hour intervals reveals recent peaks reaching about70, 937followed by mild corrections.Volume remains subdued without significant spikes suggesting measured participation instead of exuberant buying.
This behavior resembles shallow consolidation or bull flag patterns just below key resistances but lacks strong volume surges needed for sustained breakouts.In essence,this phase represents indecision rather than aggressive upward moves.BTC is coiling tightly but hasn’t yet demonstrated convincing follow-through strength.
Oscillator readings portray neutrality with no clear directional bias.The Relative Strength Index (RSI) hovers around 39 indicating neither overbought nor oversold conditions.Stochastic oscillator stands near 47 while Commodity Channel Index (CCI) registers -43—both neutral territory.Average Directional Index (ADX) reads 56 signaling trend strength without specifying direction.Awesome Oscillator shows negative values consistent with stabilization.Momentum indicators including MACD reflect modest upside pressure collectively reinforcing sideways movement rather than decisive trends currently dominating BTC’s trajectory.
Moving averages paint mixed signals.Short-term exponential moving average (EMA10-day) sits slightly above current prices at about70&comma146,and simple moving average(SMA10-day) aligns closely at69&comma107indicating tentative upward pressure.Yet longer-term averages such as EMA20 ($73&comma841), SMA20 ($74&comma184), EMA30 ($76&comma965), SMA30 ($79&comma518), EMA50 ($81&comma187), SMA50($84&comma269), EMA100($87&comma842), SMA100($87&period696), EMA200($94&period124)&;SMA200($100&period569)&- all suggest persistent downward forces remain dominant across extended periods.Short term efforts towards stabilization face formidable overhead resistance barriers.
Bullish Scenario:
A clean four-hour candle closing beyond72 ,& nbsp ;00would validate short-term bullish momentum opening targets towards75 , & nbsp ;00with subsequent extension potential up to80 , & nbsp ;00.The established higher low (~65 , & nbsp ;080 ) combined with rising highs supports constructive foundations while aligned short term MAs(EMA10/SMA10)&supplementary positive momentum indicators reinforce upside prospects.Sustained breakout accompanied by increasing volumes could transition current relief rally into durable recovery phase.
Bearish Scenario:
Failure to surpass critical72 ,& nbsp ;00resistance followed by retreat below68 ,& nbsp ;00would reassert dominance of prevailing daily bearish trend.Lower highs persist alongside ongoing consolidation beneath major resistances.Long term MAs including EMA50,SMA100&succeeding levels continue signaling downside risks.Breakdown under65 ,& nbsp ;00 exposes pivotal structural floor @60 ,& nbsp ;00whose loss strongly confirms continuation deeper bearish trajectory .
Frequently Asked Questions ❓
What is bitcoin’s latest trading value on February 15th ,2026 ?
Bitcoin trades presently around69 ,397within day range spanning from69286to70897 .
Is bitcoin showing bullish or bearish tendencies now ?
Daily charts indicate technically bearish posture whereas4 -hour data suggests emerging short term bulls battling just below72000resistance threshold .
Which levels act as main bitcoin supports and resistances ?
Key resistances include720007500080000whilesupportsexistat680006500060000structuralpivotpointrespectively .
What do technical indicators reveal today regarding bitcoin’s condition?
RelativeStrengthIndex(RSI ),StochasticOscillator,andCommodityChannelIndex(CCI )allhovernearneutralzonesreflectingmarket indecisionratherthanclearmomentumbiases..