The daily Bitcoin chart reveals a significant transformation in the market’s structure, with price movements delving further into a pronounced long-term downtrend. After peaking near $120,000, Bitcoin was unable to sustain its upward trajectory and started forming successive lower highs and lower lows. This shift allowed sellers to dominate as the price fell beneath multiple Fibonacci support levels.
Currently trading around $66,000, Bitcoin finds itself at a crucial juncture where investors are closely monitoring for signs of either stabilization or continued decline. Beyond just price fluctuations, data from derivatives and spot markets collectively indicate a cautious atmosphere among traders who remain defensive while awaiting clearer directional cues.
Bearish Momentum Controls Market Dynamics
The technical landscape continues to favor bearish forces as Bitcoin struggles below previously established support zones. The rejection at the 0.618 Fibonacci retracement level near $101,000 marked a pivotal reversal point.
Following this setback, downward pressure intensified when prices broke through supports at $85,700 and subsequently undercut $76,100. These breaches confirmed that the prevailing bearish trend is more than just a temporary pullback but rather an ongoing structural decline.
Additionally, Bitcoin remains below dynamic resistance levels highlighted by indicators such as Supertrend. Momentum indicators like ADX registering above 55 underscore sustained trend strength instead of market indecision.
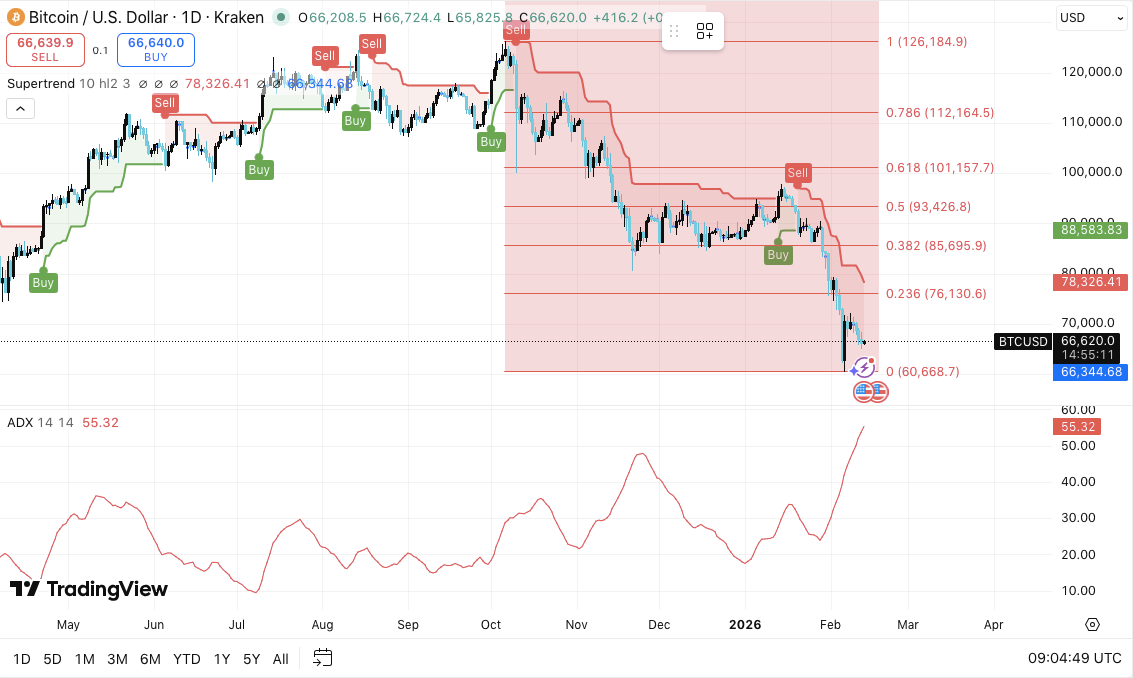
This scenario means buyers must demonstrate significantly stronger demand before any meaningful reversal can take place. Analysts are focusing on the support zone between $66,600 and $60,700 as critical for maintaining stability. Moreover, $60,000 acts as an important psychological barrier that could serve as last line of defense before deeper declines unfold.
Open Interest Indicates Deleveraging Phase
The derivatives market presents additional insights complementing this bearish outlook. Open interest surged sharply during prior rallies reaching close to $80 billion amid increased leverage usage by traders.
Source: Coinglass
However, recent sessions have seen open interest steadily contract toward approximately $44.6 billion. This reduction signals that traders are actively reducing risk exposure by closing positions amidst heightened volatility conditions.
This deleveraging process not only lowers liquidation risks but also tends to reset market dynamics preparing for cleaner directional moves ahead. At the same time, a drop in leverage reflects diminished confidence in short-term upside potential which leads to more selective participation rather than aggressive speculation.
Spot Market Flows Reinforce Defensive Sentiment
Source: Coinglass
The flow of capital within spot markets adds another dimension supporting bearish sentiment. Persistent outflows across exchanges highlight ongoing selling pressure from investors.
While occasional inflow spikes temporarily slowed down declines they failed to generate lasting momentum.
A recent net outflow nearing $49.96 million further emphasizes investor caution during this period.
Technical Levels Shaping Bitcoin’s Path Forward
The key technical thresholds remain well-defined within this broader downtrend framework:
- Bullish hurdles: $76,100 serves as initial resistance followed by major Fibonacci barrier at $85,700.
—> if surpassed strongly these could pave way toward macro supply zone between $93,400–$101,000 where sellers previously regained control. - Bears’ defense: $66,600–$60,700 constitutes immediate support cluster with psychological floor around $60,000 critical for maintaining stability.
if broken decisively it may trigger extended downside targeting deeper macro supports. - Main resistance band: $76,000–$85,000 range represents essential area needing reclaiming for medium-term bullish momentum otherwise selling pressures likely persist during rallies.
This analysis suggests that despite some compression in volatility near key supports bitcoin remains entrenched within strong bearish momentum awaiting either breakout or breakdown scenarios defining next major move directionality..
Can & #39 ; t Bit coin Re bound ?
The immediate future hinges on whether buyers can successfully defend $ ; 60 , 000 – $ ; 66 , 000 region long enough to temper current downward bias . Derivatives data showing declining open interest confirms deleveraging activity resetting speculative positioning . Meanwhile , spot flows continue indicating persistent capital withdrawals reflecting trader wariness .
Should buying strength return accompanied by robust inflows , Bit coin might rally back towards $ ; 76 ,100 then potentially challenge $ ;85 ,700 resistance . Conversely failure below $ ;60 , 00 threshold risks accelerating losses extending overall correction phase .
At present Bit coin stands at critical technical crossroads with high trend intensity yet requiring volume confirmation alongside supportive market flows before establishing clear path forward .
Related : Chain link Price Forecast : LINK Approaches Cycle Lows Despite Increasing Real – World Defi Adoption
Disclaimer : This article provides information solely intended for educational purposes without constituting financial advice whatsoever.Coin Edition disclaims responsibility arising from actions taken based on content herein.Readers should exercise due diligence prior engaging related activities or investments .