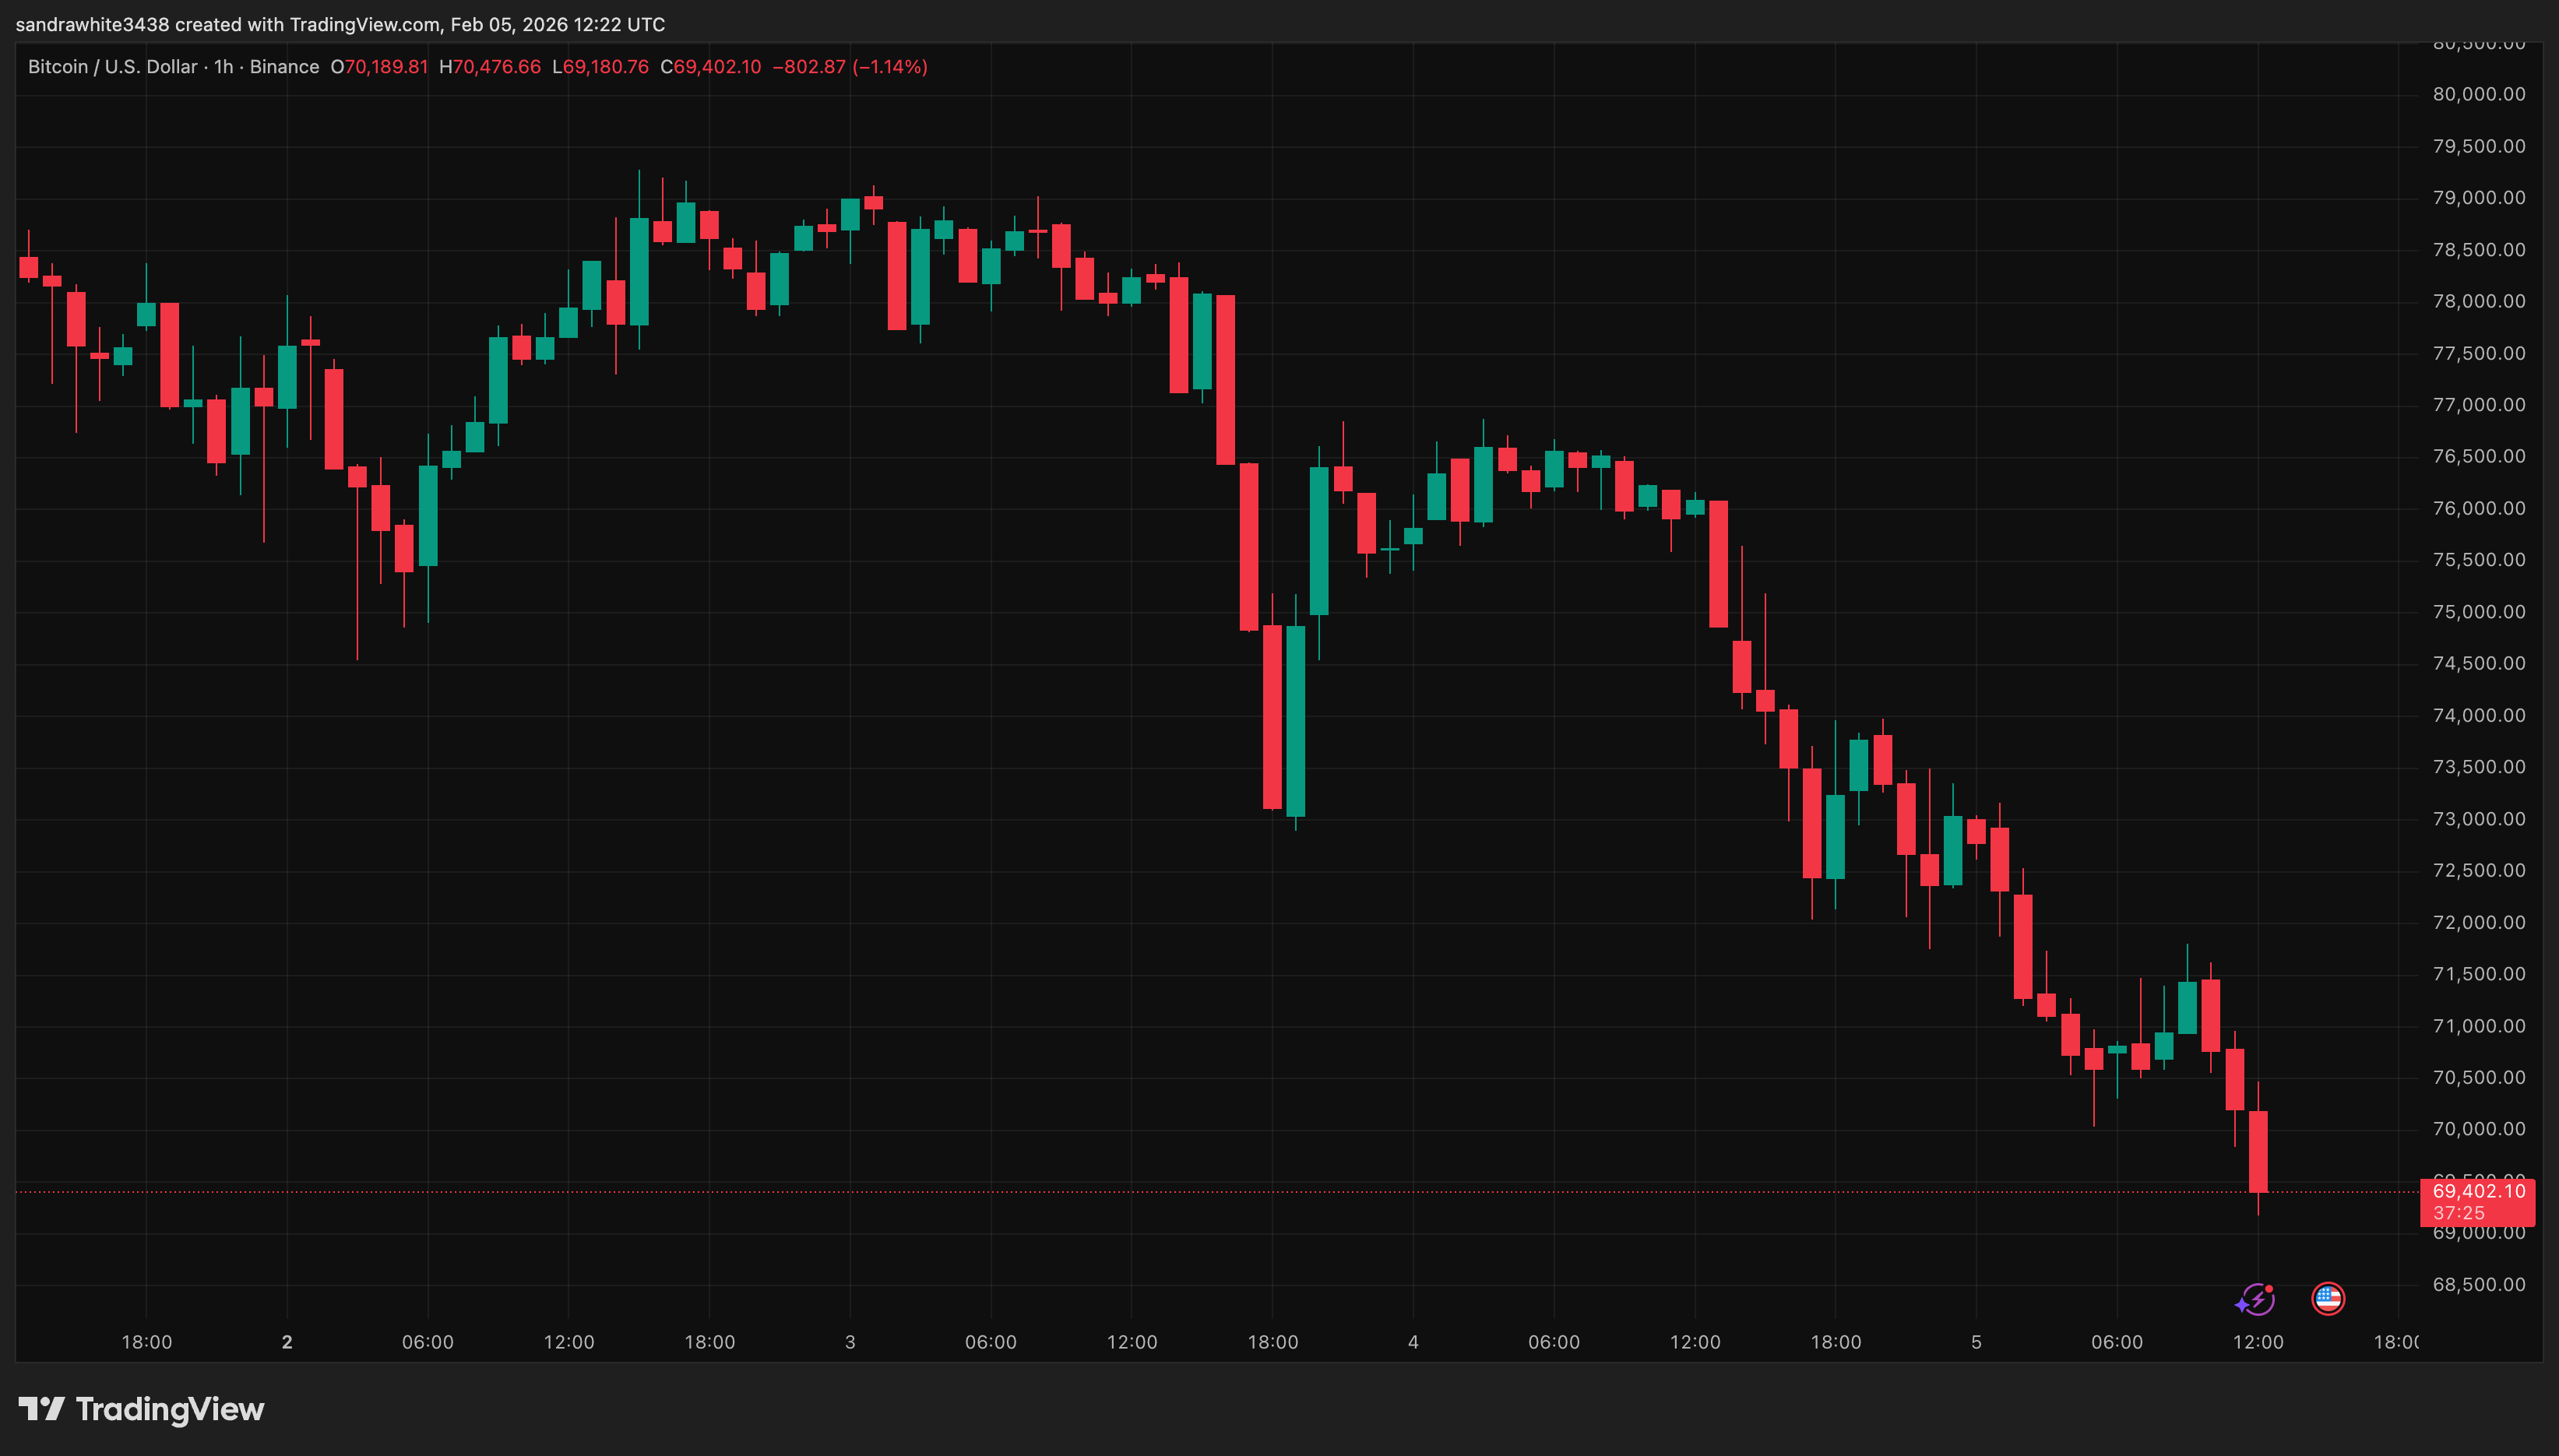
The Bitcoin market has experienced significant turbulence recently, marked by a sharp sell-off that pushed its value down into the $70,000 territory. This decline erased many short-term bullish bets and caused the price to fall below several key intraday support levels. Despite the possibility of further declines, Bitcoin appears to be stabilizing and aiming to regain crucial price benchmarks. Technical analysis indicates that under certain conditions, a swift recovery toward the $81,000 level could be on the horizon.
Testing The Annual Low
A notable event on the chart is Bitcoin’s dip below last year’s candle low near $74,456. This move cleared out liquidity trapped beneath previous lows and represented a deliberate downside sweep that had been anticipated for months.
From a market structure standpoint, such sweeps act as reset points by shaking out weaker holders and enabling prices to establish a firmer foundation. Following this liquidation phase, Bitcoin rebounded back up to around $77,000—indicating buyers stepped in strongly at this level. This area is now evolving into a critical decision zone where future directional momentum will become clearer.
Crypto analyst Minga shared insights on X (formerly Twitter), noting that Bitcoin returned to test its weekly open just under $77,000. Maintaining support above this threshold would suggest genuine recovery momentum and pave the way for revisiting the monthly open at approximately $78,700. The analyst’s chart also highlights multiple equal highs clustered just above this point within prior range lows.
Together these factors create an unresolved zone of interest: if Bitcoin can reclaim and hold above its weekly open level convincingly, there is an increased likelihood it will break through monthly resistance levels—potentially driving prices further into the low $80k range where historical liquidity sits near $81,000.
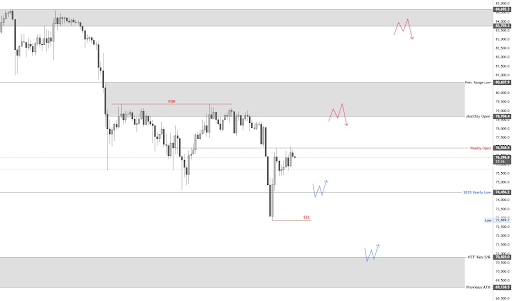
Bitcoin Price Chart — Source: @Mingarithm on X
Potential Downside And Support Zone Below
An alternative scenario exists if Bitcoin fails to sustain gains above its weekly open—a situation currently unfolding in recent trading activity. Should resistance persist here, deeper retracement targets between roughly $70,800 and $69,100 come into focus as significant support zones.
This lower band represents an area with strong confluence factors including higher timeframe order blocks (areas of past institutional buying), 50% Fibonacci retracement levels from recent moves, as well as alignment with 2021’s all-time high cycle peak—making it highly relevant for potential rebounds or consolidation phases.
At present writing time, $70,930 (down about 7.2% ) marks current trading levels, risking breach below $70,000. if prices manage to hold steady after testing these supports, a sideways trading range may develop before any renewed attempt pushes beyond $81,000.
Featured image generated using Dall.E, complex charts sourced from Tradingview.com