Bitcoin is currently under fresh technical scrutiny as an experienced trader highlights the completion of a bearish channel, cautioning that downward momentum remains dominant unless a crucial price threshold is firmly regained.
Peter Brandt, a seasoned market analyst and trader, shared insights on January 25, 2026, via social media platform X. He pointed out that Bitcoin has formed a completed bear channel pattern, which typically signals ongoing selling pressure unless key resistance levels are reclaimed.
Brandt stated:
“Another sell signal has emerged for Bitcoin with the completion of this bear channel.”
He further emphasized:
“Keep in mind that chart patterns can evolve. The price must break back above $93K to invalidate this bearish outlook.”
This commentary reflects Brandt’s adherence to traditional charting methods where finished bear channels often suggest sustained downside rather than immediate recovery. His mention of charts’ fluidity underscores how technical analysis adapts in volatile markets like Bitcoin’s—where trends may quickly reverse or fail.
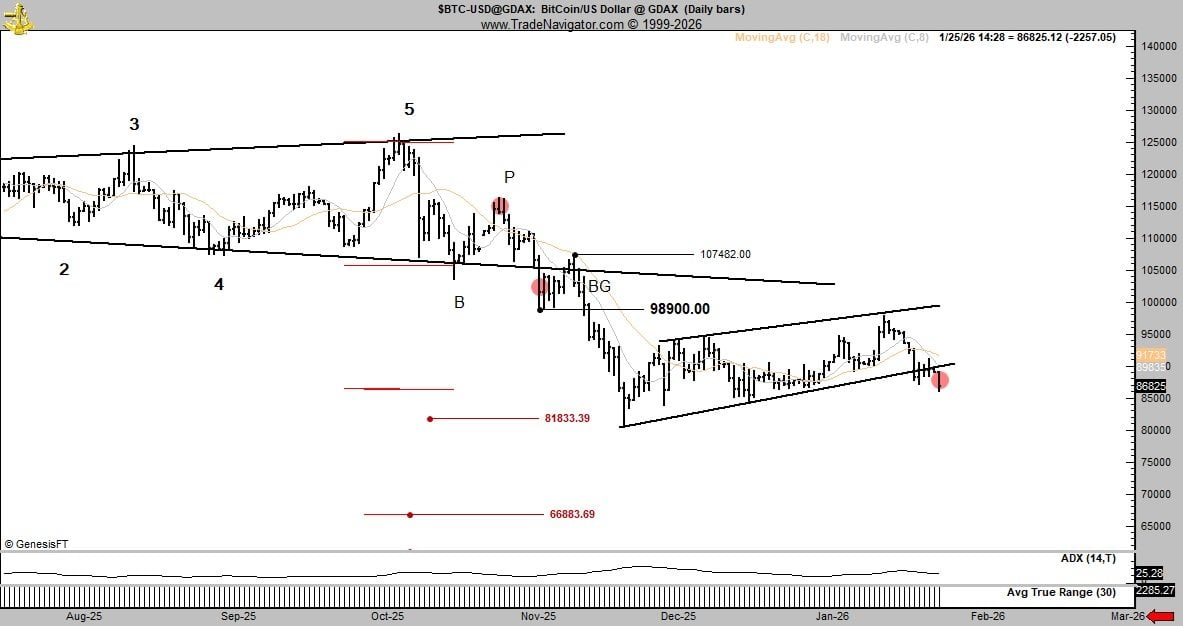
The accompanying chart revealed Bitcoin trading below descending moving averages and capped by a long-term downtrend line near $107,482. A former support area around $98,900 appears to have turned into resistance. Additionally, an ascending structure from early January collapsed, reinforcing the prevailing bearish narrative unless prices climb back above the critical $93K mark.
For further context: Peter Brandt recently suggested that Bitcoin could be headed toward the $58K–$62K range.
On January 19th, Brandt also shared his perspective on potential deeper declines while acknowledging inherent forecasting uncertainties:
“$58K to $62K is my expected target range.”
'If it doesn't reach there I won't be embarrassed — I am wrong about half the time and comfortable with that,''
This candid admission highlights his probabilistic mindset when interpreting charts—viewing projections as possibilities rather than certainties. The indicated lower price zone corresponds with historical support levels seen on longer-term analyses and aligns with measured moves derived from previous breakdowns.
Although these targets imply notable downside risk compared to current valuations, past episodes have shown Bitcoin can invalidate similar bearish forecasts through sudden trend reversals triggered by shifts in liquidity conditions, derivative market adjustments, or renewed buying interest at spot levels. These dynamics illustrate how Brandt’s scenarios serve as important risk indicators within broader analytical frameworks instead of guaranteed outcomes.
Frequently Asked Questions ⏰
What specific sell signal did Peter Brandt identify for Bitcoin?
He highlighted the formation of a completed bear channel indicating continued downward pressure.
Why does reclaiming $93K matter according to Brandt?
Surpassing this level would negate the current bearish setup.
Which technical resistances are limiting Bitcoin’s upward movement?
Falling moving averages along with resistance zones near $98,900 and approximately $107,482 act as barriers.
What support areas were noted for potential downside protection?
Support zones around $81,833 and roughly $66,883 were identified on charts.