
The price of Bitcoin is currently stabilizing beneath previous range highs, and the emergence of a bear flag pattern indicates that there is still significant downside risk, with $80,000 identified as a crucial support level.
Summary
Bitcoin has dropped below its previous range high, which has now turned into strong resistance. A bear flag is forming around the midpoint of this range, suggesting ongoing risks for further declines. The $80,000 mark serves as an essential support point where liquidity may be concentrated.
Recent movements in Bitcoin’s (BTC) price indicate a bearish trend as it consolidates under an important resistance area. After failing to maintain the upper limit of its trading range, BTC saw a sharp decline and has been fluctuating near the midpoint of its broader trading band. Although consolidation often brings uncertainty to market dynamics, the current structure raises red flags.
From a technical perspective, Bitcoin seems to be establishing a bear flag—a continuation pattern that usually resolves in line with prevailing trends. With liquidity still lying beneath current levels, this setup implies that there remains substantial risk for further downward movement.
Key Technical Aspects for Bitcoin Price
Loss of former range high turned into resistance: Previous support now limits upward movement.
Bear flag emerging at midpoint: A classic continuation formation indicating potential downside resolution.
$80k remains vital support: A breach could lead to significant liquidity-driven declines.
You might also like: Is Ethereum gearing up for a breakout towards $4K while BitMine pursues 5% supply stake?
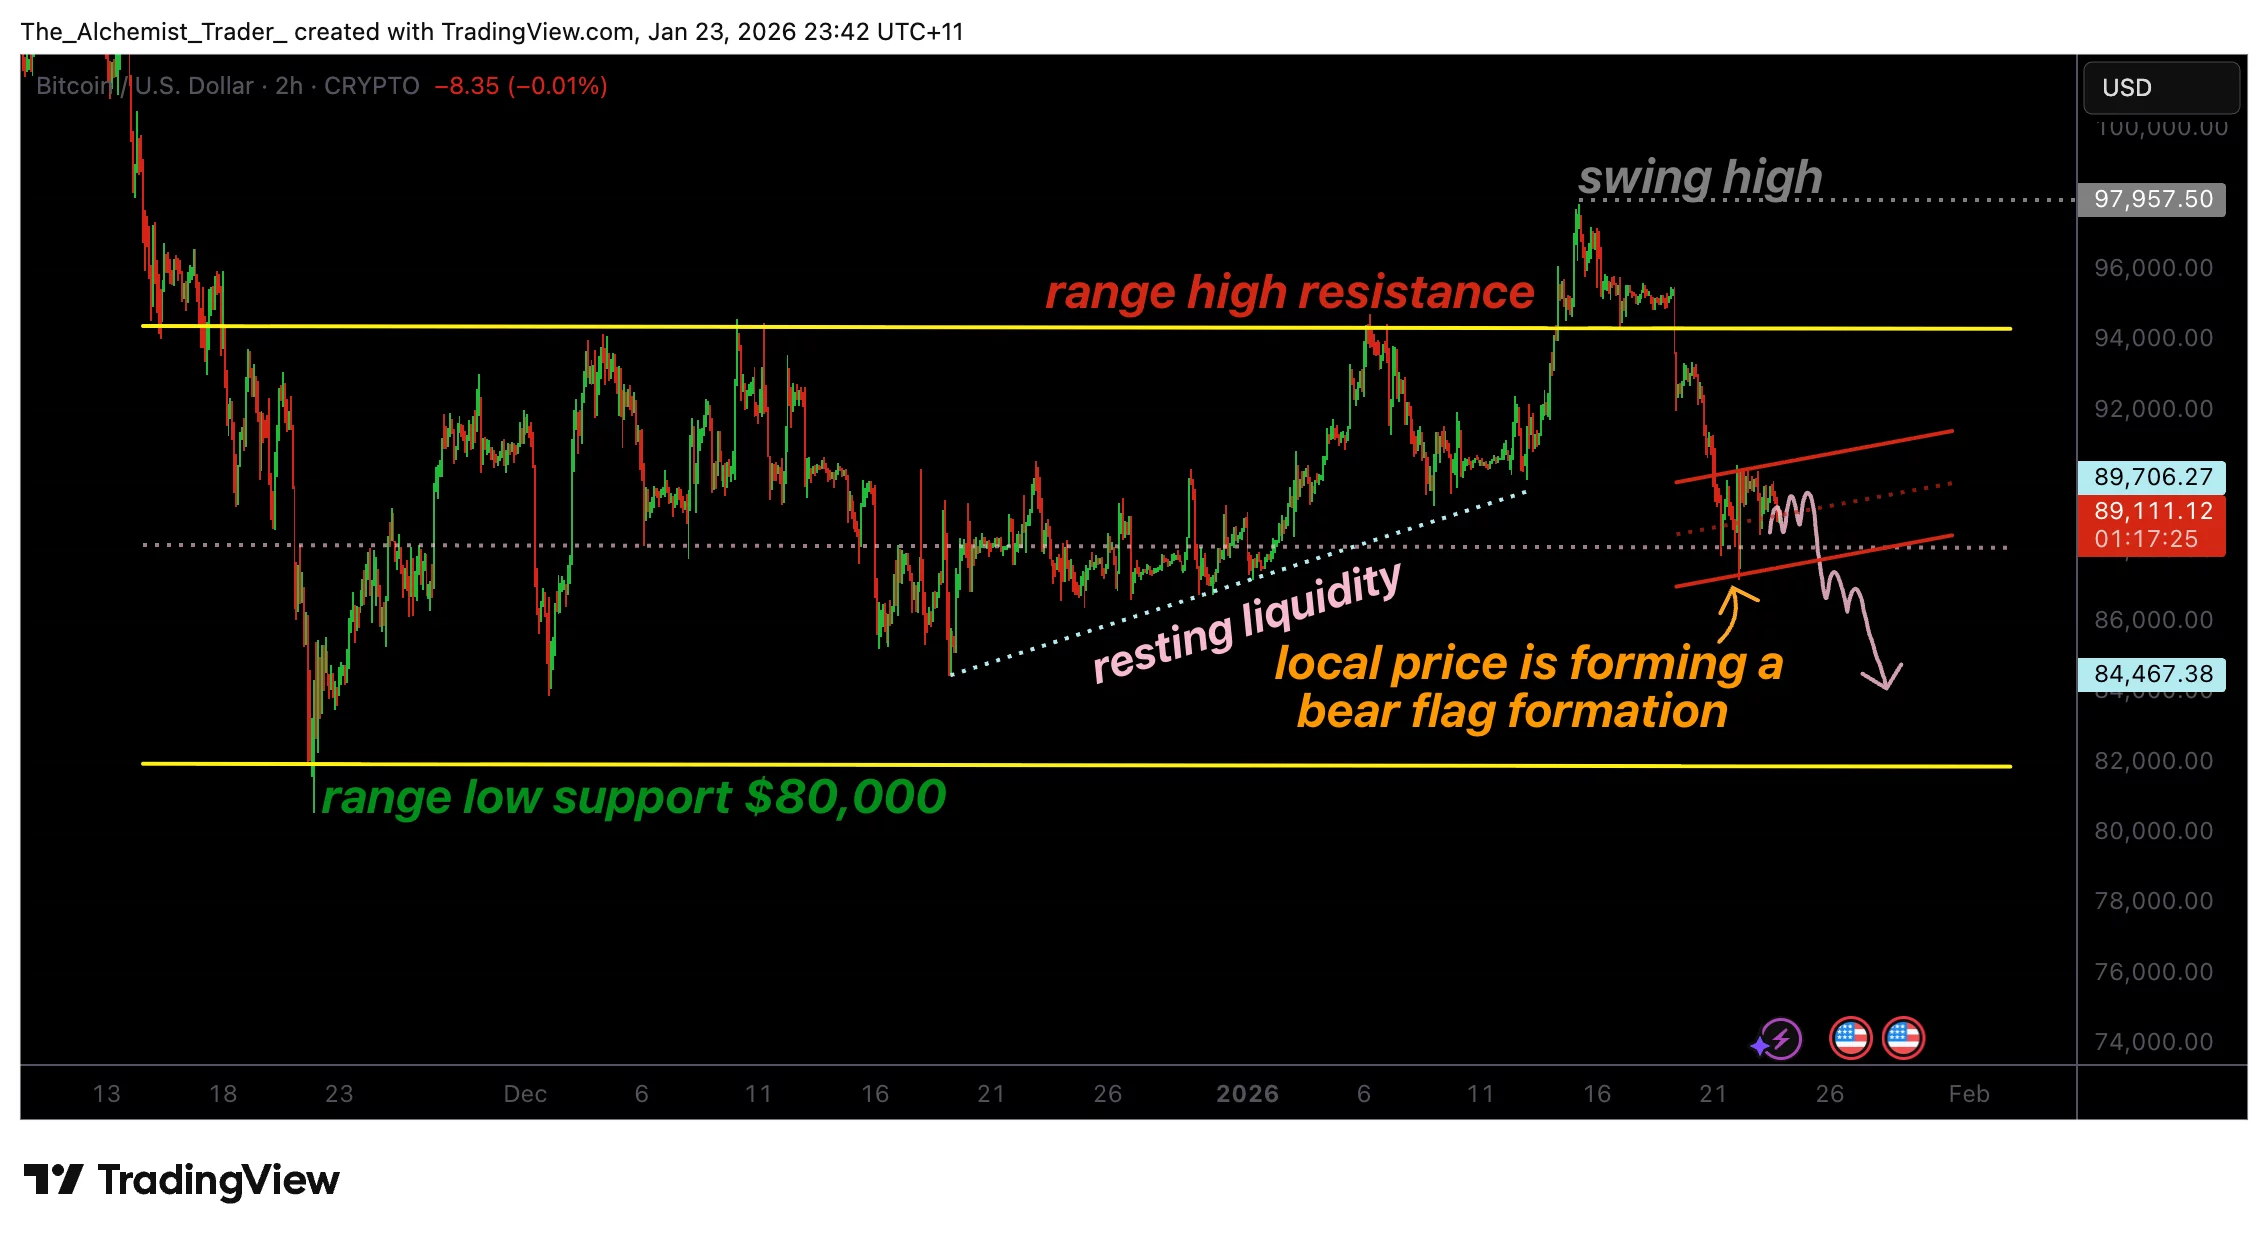
BTCUSDT (2H) Chart Source: TradingView
A pivotal change in Bitcoin’s recent pricing behavior has been its failure to hold onto the former high point within its trading range—once seen as key support. Following this deviation above said level without achieving sustained acceptance led sellers to enter aggressively and push prices lower significantly. This shift altered market sentiment from neutral toward bearish.
Since then, what was once considered supportive has become resistant territory; thus reinforcing perceptions that attempts at recovery are being met with selling pressure rather than buying interest. Such role reversals are typical within trending markets and often indicate seller dominance.
You might also like: Zcash forms head-and-shoulders pattern amid whale sell-offs; eyes set on $300.
The Bearish Nature of Current Consolidation
In light of recent downward momentum, Bitcoin finds itself in a consolidation phase around mid-range levels. At first glance,this sideways action could suggest market stabilization; however,the underlying structure tells another story.As opposed to forming broad bases or showing accumulation signs,the price appears confined within descending channels.
This configuration closely mirrors characteristics associated with bear flags—a bearish continuation signal following steep sell-offs.Bear flags typically denote pauses during which markets process losses before resuming dominant trends.The longer prices remain trapped inside such formations without reclaiming resistance points,the greater likelihood exists for subsequent breakdowns downwards.
The Importance Of The Bear Flag Formation
Bearing flags hold significance due their representation weak demand during periods consolidation.In healthy reversals,buyers usually engage vigorously pushing prices higher alongside increasing volumes.In contrast,Bitcoin’s present state lacks robust bullish follow-through.Volumes have generally contracted while upward attempts remain shallow at best.
If we analyze probabilities,bear flags statistically favor sellers’ outcomes.Although they don’t guarantee specific results,the overall context—the loss incurred at prior highs combined with bearish impulses—adds weight behind negative scenarios unfolding ahead!
You might also like: Exploring Gonka’s vision for decentralized computing infrastructure.
$80k Support Level And Resting Liquidity Pools
The next critical milestone lies at $80k representing significant long-term supports zones.This area contains resting liquidity implying stop orders along unfilled bids likely congregate here.Markets naturally gravitate towards these liquid pools especially when momentum aligns accordingly!
If confirmed through breakdowns via established patterns,a move targeting toward those very same boundaries becomes logical!Testing out these thresholds would allow room rebalancing whilst potentially creating more meaningful bases moving forward.Failure holding onto these levels opens doors deeper downsides exposing vulnerabilities across board leading wider corrective phases altogether!
Bears Dominate Market Structure Overall
An analysis surrounding general market structures reveals how consistently lower highs form below resistances reinforcing prevalent negative biases.Until such time arrives wherein prior ranges get reclaimed alongside acceptance observed above them,rallies should continue viewed merely corrections rather than true trend shifts themselves!
<p.Given all aforementioned factors,persistence proves essential here.Consolidations can extend longer than anticipated yet technical frameworks suggest heightened downside risks persist until bears successfully maintain control over existing structures intact throughout future developments ahead!