Over the last two days, Bitcoin has demonstrated notable resilience, currently trading in the mid-$90,000 range after a period of consolidation near $90,000. Market analyst Jackis provided an insightful evaluation of Bitcoin’s potential next major move amid recent attempts to break above the $95,000 mark. He outlined clear scenarios supporting both bullish and bearish outcomes.
Both Bullish and Bearish Perspectives Are Valid; Confirmation Is Key
Bitcoin recently climbed back above $95,000 following a 3.1% gain within 24 hours. This price movement alone hints at a possible bullish trend emerging. Nevertheless, traders are advised to rely on chart signals to determine what lies ahead rather than speculation.
According to Jackis—a crypto analyst active on platform X—arguments alone don’t suffice since there are compelling cases for both upward and downward movements in Bitcoin’s price. He noted that similar price patterns have historically resolved differently across various market cycles.
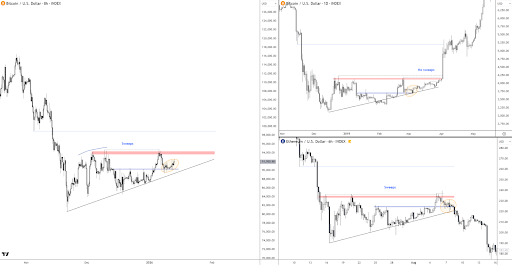
The accompanying chart illustrates that Bitcoin is currently forming an ascending triangle pattern on the 8-hour candlestick chart. Historically, this formation has preceded both bullish reversals—as seen with Bitcoin—and bearish continuations—as observed with Ethereum—demonstrating its ambiguous nature.
Based on his analysis, Jackis leans slightly toward a bearish continuation unless proven otherwise by market action. Both positive and negative outlooks hold merit at this stage but require confirmation through actual price behavior.
Potential Bullish and Bearish Outcomes for Bitcoin
The direction of the breakout will likely dictate rapid follow-through moves in either case—meaning holding onto positions against momentum could lead to significant losses.
On the upside, Jackis pointed out that breaking past $96,000 would validate a bullish continuation scenario potentially propelling prices toward $107,000 or beyond.
Conversely, his bearish trigger centers around the rising support line within the ascending triangle pattern. While price may appear stable up until this trendline breaks downwards—the breach would signal increased chances of further declines.
If Bitcoin falls below this lower trendline support level of its current structure it might retrace back towards lows seen around April 24th last year — which marked roughly $76,000 after rejecting highs near $106,100 in January 2025 followed by several months of correction.
This breakdown would shift market sentiment away from sideways trading near mid-$90k levels toward resetting expectations entirely downward.
Featured image courtesy Pixabay & chart sourced from Tradingview.com