In its most recent technical review of Bitcoin’s price movements, the crypto analytics firm Layergg emphasized several crucial thresholds, especially visible on the monthly and weekly charts. The company cautioned that there is a potential for weakening trends over the medium to long term.
Layergg’s evaluation points out that the previously established criteria supporting Bitcoin’s upward momentum on the monthly chart are now facing significant challenges. They highlighted that sustaining a monthly uptrend depends on three main factors: preserving the MACD golden cross, ensuring monthly candlesticks close above both the 20 EMA and 20 MA, and maintaining the 20 EMA above the 20 MA.
The analysis revealed that the first condition—the MACD golden cross—has already failed. Meanwhile, both remaining conditions are under threat as current monthly candles hover near these moving averages. Layergg noted uncertainty in direction at this stage and indicated that how Bitcoin closes during early 2026 will be critical in determining future trends.
The weekly chart offers a more definitive perspective according to Layergg’s report. It shows that Bitcoin’s weekly uptrend has been disrupted. To negate this bearish outlook, Bitcoin must secure weekly closes above approximately $105,000 to $107,000. Failing this could lead to a “death cross” between its weekly 20 EMA and 50 EMA—a signal often associated with prolonged downward pressure. The firm also compared present price action patterns with those observed back in March-April of 2022.
In terms of short-term movement, Layergg describes market behavior as consolidative. The next clear directional shift is expected once prices either break through resistance around $94,000–$96,000 or drop below an identified red trend line support level. A successful breakout upwards might spark a relief rally targeting $105,000–$107,000 again; conversely breaking downwards could drag prices toward at least $69,000–$71,500 territory.
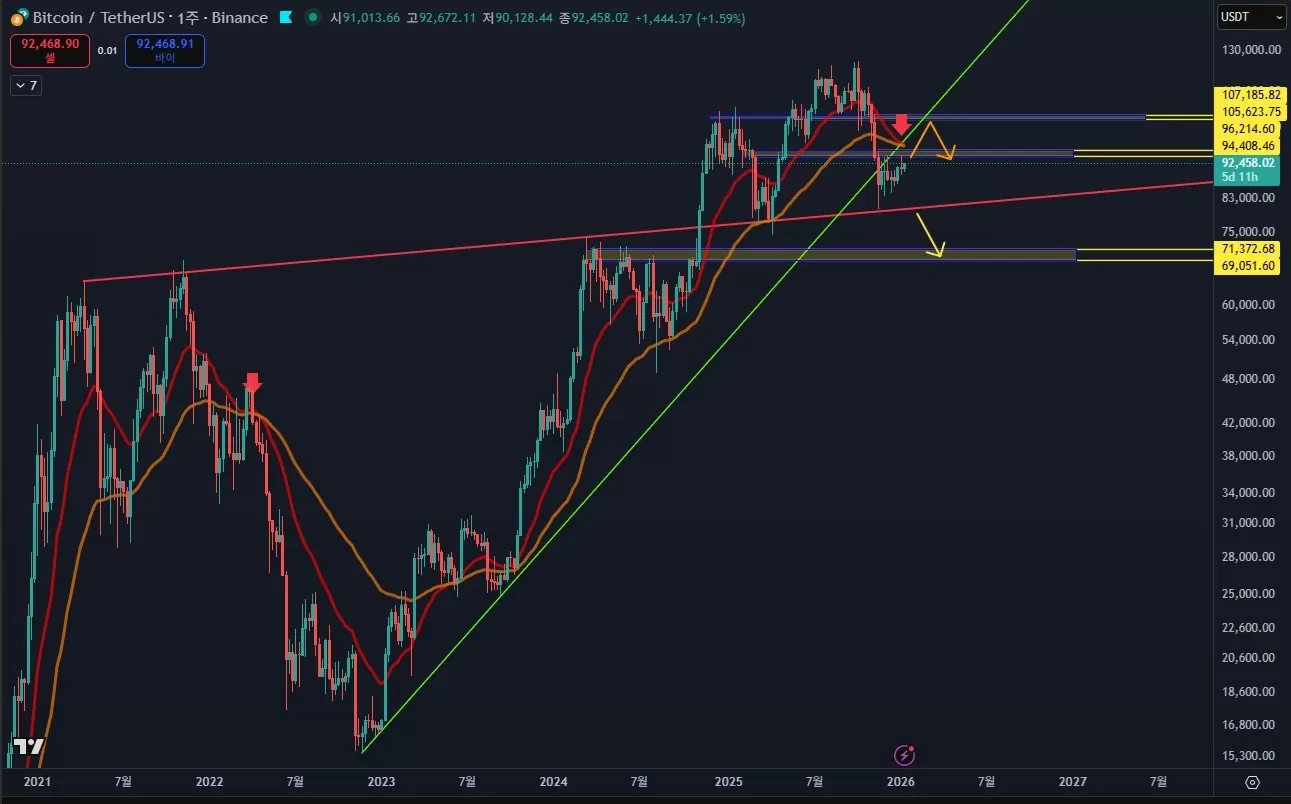
Technical analysis chart provided by Layergg.
*Please note: This content does not constitute financial advice.*