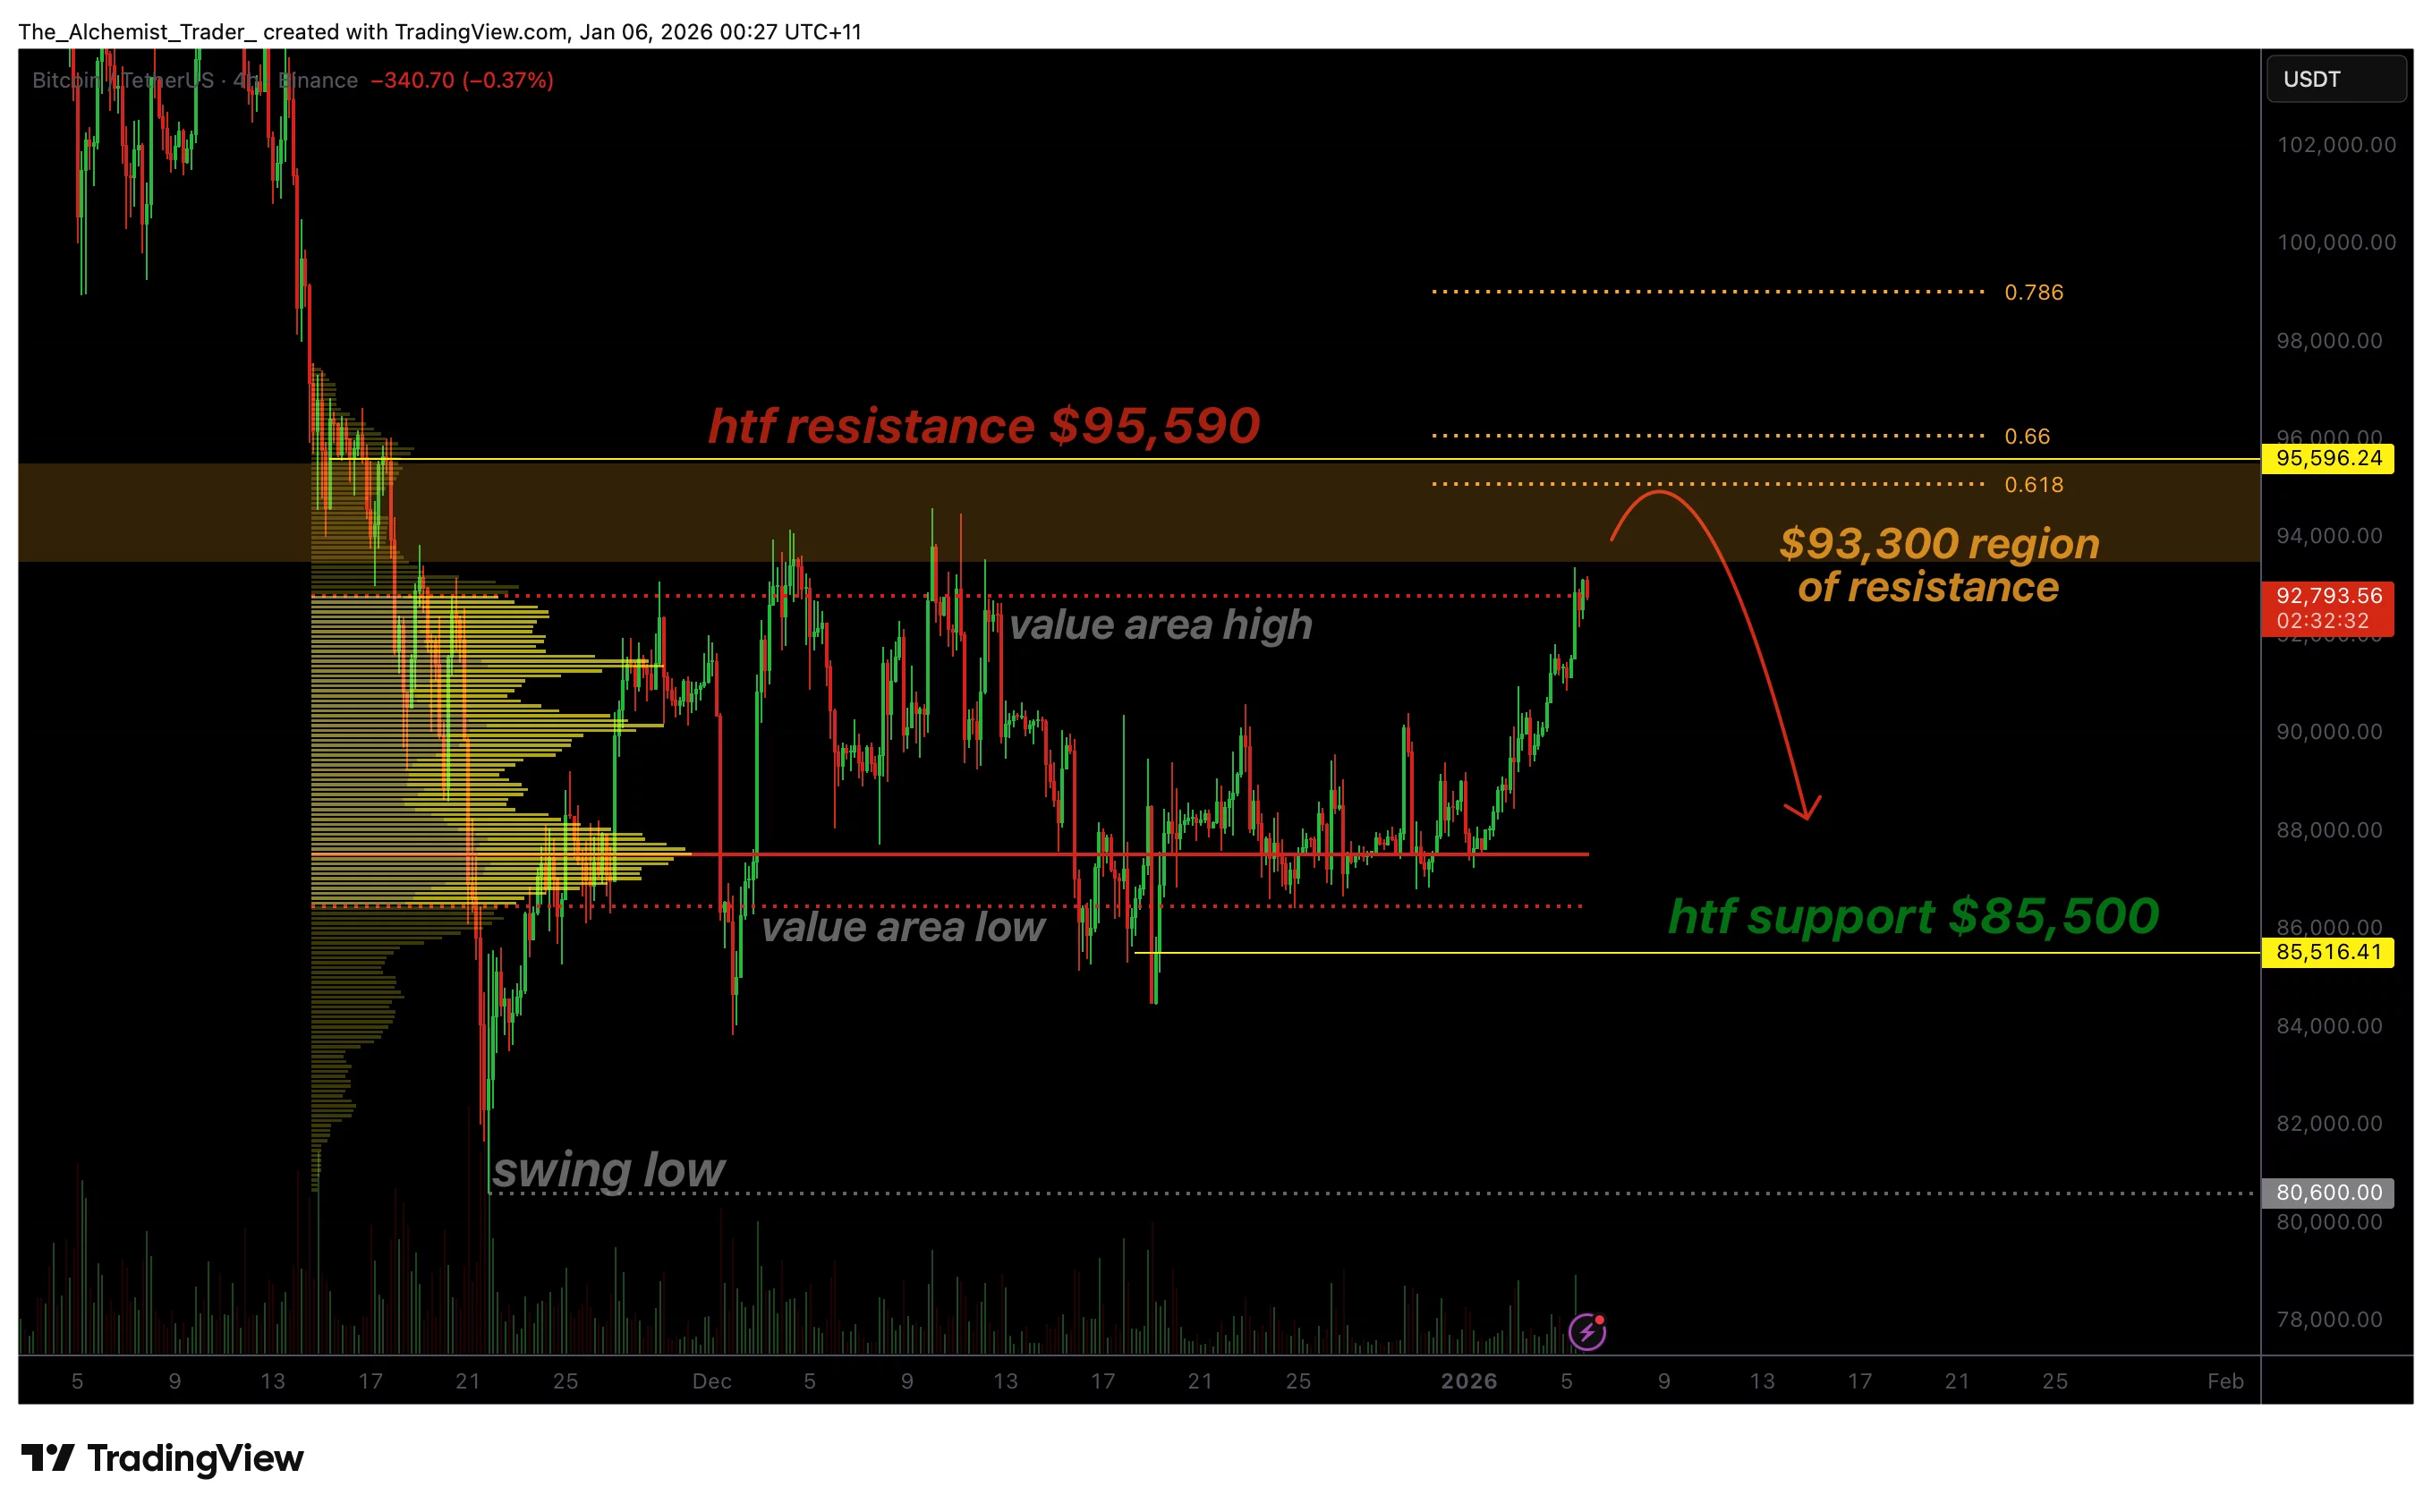
The price of Bitcoin has surged up to the resistance level near $93,300, but this move is accompanied by weak trading volume. This raises concerns about a possible distribution phase and the likelihood of a downward correction toward lower support zones.
Summary
Bitcoin is currently challenging a significant resistance point at $93,300 where multiple technical indicators converge.
The upward momentum lacks strong volume backing, casting doubt on its durability and suggesting potential distribution.
If Bitcoin fails to break above this resistance convincingly, it may retreat toward the support area around $85,500.
In recent days, Bitcoin (BTC) has climbed higher as buyers push prices into a critical resistance zone near $93,300. Although this advance places BTC at the upper edge of its recent trading range, technical signals advise caution. This region coincides with several key resistance factors and has been reached on relatively low volume levels.
This suggests that the current rally might not have enough strength for sustained gains and increases the chance of sellers stepping in to initiate a corrective decline.
Key Technical Insights for Bitcoin Price
- The $93,300 level represents an area with overlapping resistances: it matches the value-area high from market profile analysis, aligns with the 0.618 Fibonacci retracement level, and corresponds to daily chart resistance points.
- The rally’s low trading volume raises doubts about its sustainability since limited participation reduces follow-through potential and favors sideways or downward moves.
- If Bitcoin cannot reclaim this zone decisively as support soon after testing it as resistance, there is heightened risk for price rotation back down toward approximately $85,500—a previously established support level.
The cluster around $93,300 acts as a dense barrier formed by various technical factors. Price action reaching this value-area high typically slows down due to balanced buying and selling pressure emerging here. The presence of both Fibonacci retracement levels and daily timeframe resistances further strengthens this zone’s significance. When such multiple signals align closely together in one region on charts—markets often hesitate or reverse rather than continue pushing higher without pause or consolidation phases taking place first.
Up until now though BTC hasn’t shown clear acceptance above these hurdles; instead prices have stalled indicating supply pressure increasing against buyers attempting further advances beyond that threshold point.
Volume Patterns Indicate Potential Distribution Phase
A major concern lies in how thinly traded today’s rally into that strong overhead supply zone actually was—the below-average volumes weaken confidence among bulls trying to sustain momentum upwards.
Strong breakouts usually require expanding volumes reflecting commitment from institutional players or large traders; without these confirmations upside attempts are prone to fizzle out quickly over time. [][][][] Low-volume rallies close beneath stiff resistances frequently precede shorter-term distribution phases during which smart money offloads holdings onto latecomers chasing highs before sharp declines ensue once demand evaporates.
This scenario fits well given BTC’s proximity right now towards an established sell area marked by overlapping technical barriers combined with weakening trade activity seen so far along upward pushes towards those zones.
You might also like: Trump headlines return alongside crypto buzz: Is there room left for BTC & XRP’s 50% surge according DBTC DeFi?
Market Structure Points Toward Possible Downside Rotation Without Confirmation
An examination through market structure lens shows vulnerability remains intact while prices hover below key thresholds like 93300 USD mark.
For bulls aiming at breaking through decisively they need consistent closes above said line backed by rising volumes signaling fresh buying interest — conditions yet unmet thus far.
If those prerequisites fail then path forward most likely tilts towards mean reversion behavior characterized by pullbacks back inside prior ranges rather than breakout extensions higher.n
nnA rejection here would open doorways leading back down closer towards notable supports near 85500 USD reinforcing typical range-bound dynamics where liquidity resets following tests made upon upper limits.n
nnBears Scenario Could Be Invalidated By Strong Bullish Breakout
nn
This formidable wall isn't impossible though — if buyers manage convincing reclamation past 93300 coupled with solid daily closing candles plus noticeable upticks in trade activity especially fueled via renewed institutional inflows (like BlackRock's bitcoin ETF seeing largest capital injection within months), then bearish outlook would lose ground substantially.n
nnSucceeding here flips former ceiling into floor thereby enhancing odds favoring continuation beyond previous highs & sustaining bullish trend trajectory going forward. u003C/Pu003Enn
Till such evidence emerges however every attempt nearing these heights warrants prudence since markets hint hesitation over conviction presently while probabilities lean more heavily towards sideways movement or corrective pullbacks first ahead before any durable uptrend resumes.
rnrnOutlook For Upcoming Price Movements
rnrn
Barring breakthroughs above key hurdle located roughly at ninety-three thousand three hundred dollars technically speaking probability weighs more strongly upon rotations lower within existing ranges than clean extended rallies upwards thanks largely due weakened volumes paired alongside concentrated overhead supply zones restricting advances effectively.
rnrnA firm rejection reinforces prevailing range-bound environment whereas only decisive acceptance supported through increased participation could reset bullish bias again enabling fresh upside exploration opportunities subsequently moving forward.
“