The year has kicked off with a dramatic event that initially seemed unrelated to cryptocurrency. On January 3, U.S. Delta Force operatives extracted Venezuelan President Nicolás Maduro from his heavily guarded residence in Caracas, sending shockwaves through global financial markets. Gold prices soared beyond $4,400 per ounce, the S&P 500 gained momentum driven by technology stocks, and Bitcoin finally broke free from its prolonged period of stagnation.
Currently, Bitcoin is trading at $93,958, marking a daily increase of 2.69%. However, the significance lies not in the percentage rise but in its position above the 200-day exponential moving average (EMA) for the first time since October. Should this trend continue, Bitcoin might overcome the “death cross” pattern it formed back in November.
This development is particularly noteworthy for traders who had anticipated a victorious year under what was expected to be a crypto-friendly Trump administration.
Despite showing strong performance during the first half of last year, Bitcoin closed 2025 down by approximately 6%. Following an impressive surge of 125% throughout 2024 that propelled BTC past $100K dramatically, investors began selling once Trump assumed office—reflecting a classic “buy the rumor, sell the news” phenomenon as policy changes and regulatory expectations were already factored into prices by late 2024. Consequently, crypto holders faced losses while traditional safe-haven assets like gold and silver enjoyed their best returns since 1979.
While conventional havens thrived amid uncertainty—Bitcoin struggled to maintain levels above $90K amid mixed geopolitical signals. With Maduro now detained at Brooklyn’s Metropolitan Detention Center and oil markets gripped by fear and uncertainty (FUD), investors are flocking toward assets perceived as shields against instability.
Yet chaos can have dual effects: The same geopolitical turmoil pushing institutional funds into gold also rekindles interest among crypto enthusiasts about why Bitcoin was created initially. When governments can detain sitting leaders overnight and claim control over entire nations arbitrarily—as seen with Maduro—the appeal of an asset resistant to governmental seizure or manipulation becomes increasingly compelling again.
Bitcoin (BTC) Price: Breaking Free From Constriction
For weeks on end before today’s breakout attempt around $91K-$90K range boundaries tightened significantly around BTC price action between roughly $85K-$90K levels—a consolidation phase known as coiling tighter within narrow bands—which ended decisively today when BTC surged upward starting near $91,&498 reaching approximately $93,&925 without any upper wick formations on candlestick charts indicating strong buying pressure breaking key resistance zones cleanly.
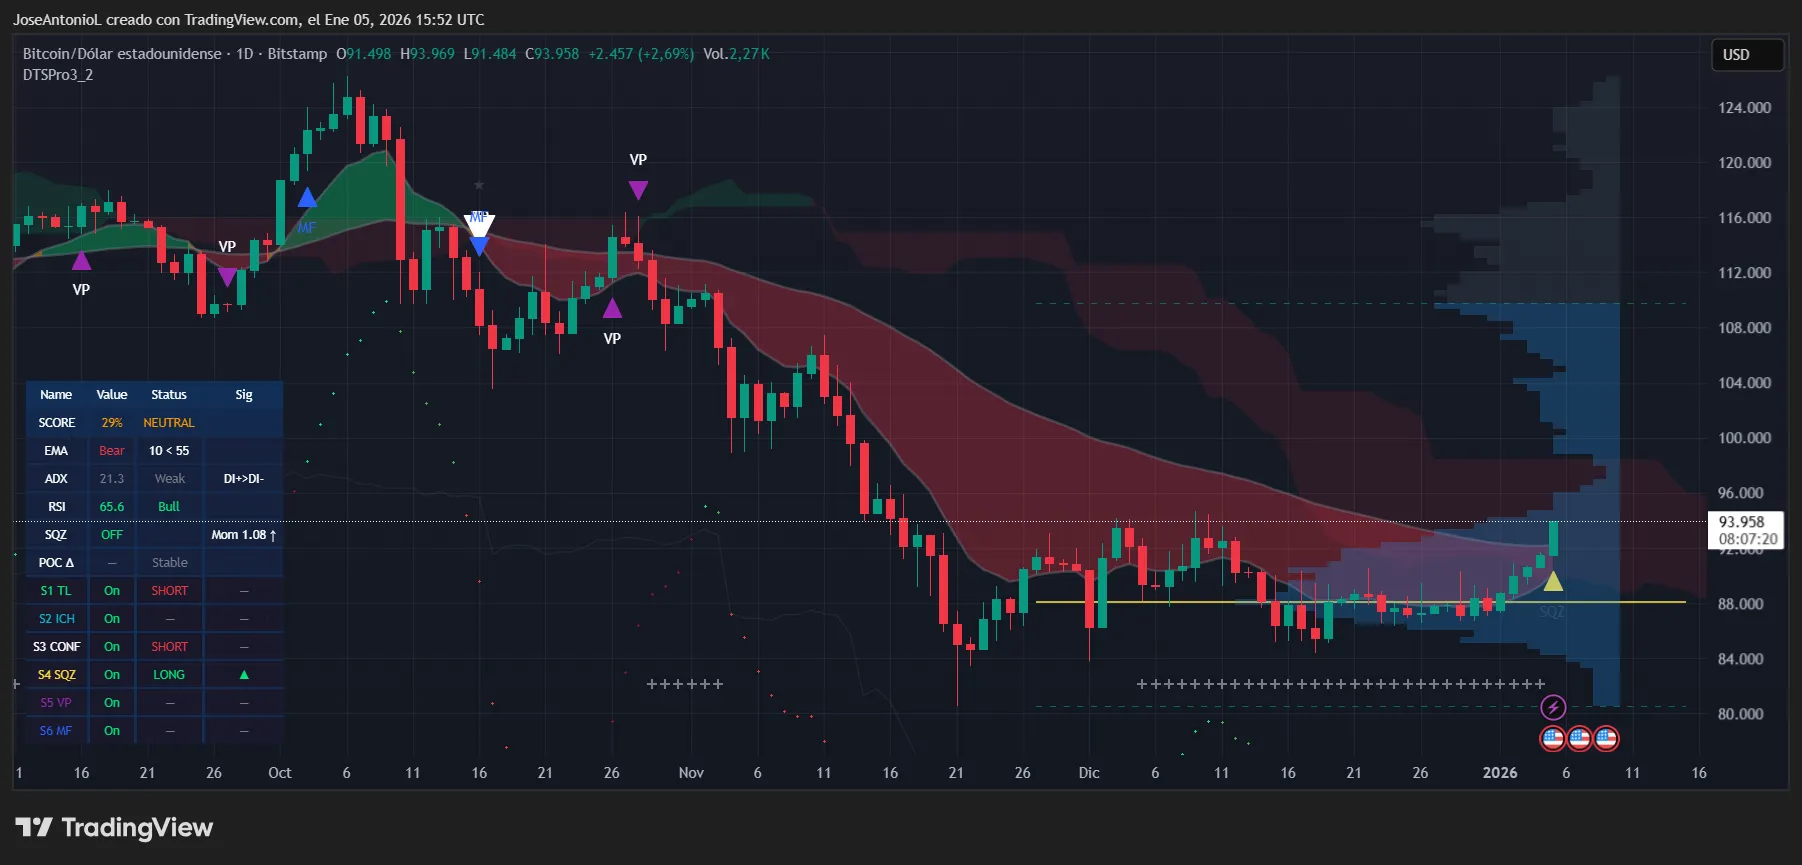
This marks its first occasion trading above its crucial long-term indicator—the 200-day EMA—since October last year—a technical boundary distinguishing bullish trends from bearish declines over extended periods. Staying above this line typically signals entry into an uptrend territory rather than battling downward forces prevailing below it which dominated months prior until now when gravity seems less influential on market directionality for bitcoin prices overall recently compared against historical data points observed previously during bearish phases globally across multiple exchanges worldwide simultaneously too!
The Exponential Moving Average (EMA) serves traders well by smoothing out price fluctuations across short-, medium-, or long-term windows helping identify prevailing trends more clearly than raw price alone could reveal — however despite crossing this important threshold upwards today some bearish elements remain intact technically speaking:
- The shorter-term 50-day EMA still sits beneath the longer-term 200-day EMA – signaling bears currently hold sway according to classic technical analysis interpretations known widely amongst professional traders as forming what’s called “death cross” patterns indicative historically often associated with extended downward momentum phases lasting several weeks/months following initial crossover events;
This death cross formation has persisted since mid-November yet recent indicators hint weakening strength behind current downtrend:
- The Average Directional Index (ADX), measuring trend intensity regardless directionality stands at about ~21.&3 suggesting reduced force behind ongoing decline since values below ~25 typically imply choppy sideways movement prone to false breakouts rather than sustained directional moves;
- The Relative Strength Index (RSI), gauging momentum between oversold (70) thresholds currently reads near ~65.&6 indicating moderate buying pressure building without reaching exhaustion levels that usually trigger profit-taking waves shortly thereafter;
<h3 style="color:#333;">What Does This Mean For Investors?</h3>
< p>In essence we find ourselves approaching critical juncture where accumulated compression resolves favorably upward reclaiming significant moving average benchmark if bitcoin manages consecutive daily closes exceeding ~$95, 000 alongside rising ADX confirming strengthening trend then potential exists for reversal pattern termed &ldquogolden cross&rdquo whereby short term averages surpass longer term counterparts heralding sustained bullish cycles ahead according historic precedents documented extensively within financial literature spanning decades plus numerous asset classes including cryptocurrencies specifically!</ p>
< p><strong>Disclaimer:</strong> The opinions shared herein represent informational content only do not constitute investment advice nor endorsement please consult qualified professionals before making financial decisions.</ p>