Bitcoin’s price showed little movement on Tuesday, even as the outflows from its spot exchange-traded funds (ETFs) appeared to slow down for the first time since December 18.
Bitcoin remained steady around $87,000 throughout Tuesday’s trading session. Notably, the net withdrawals from spot Bitcoin ETFs decreased considerably over the previous day. Technical analysis revealed a symmetrical triangle pattern developing on Bitcoin’s daily chart.
Data provided by SoSoValue indicated that twelve spot Bitcoin ETFs experienced net outflows totaling $19.29 million on Monday, December 29. This marked a pause after six consecutive days of triple-digit million-dollar outflows that collectively saw approximately $1.1 billion exit these funds.
Invesco’s BTCO led Monday’s redemptions with $10.41 million withdrawn, followed by BlackRock’s IBIT and ARK 21Shares’ ARKB with respective outflows of $7.92 million and $6.66 million. On the other hand, Fidelity’s FBTC attracted inflows amounting to $5.7 million and several other ETFs reported no significant movements in or out during this period.
The slowdown in fund withdrawals suggests institutional investors might be reaching a point of exhaustion in selling pressure, potentially paving the way for fresh capital injections if market conditions remain stable or improve.
Previously this year in October, Bitcoin surged to an all-time peak near $126,080—a rally largely driven by substantial inflows into its spot ETF products over preceding months. Since then however, these investment vehicles have seen nearly $4.6 billion flow outward.
The behavior of institutional players and major capital allocators typically shapes momentum within regulated investment channels like ETFs; their net flow trends often influence price movements along with liquidity levels and overall market risk appetite.
Additionally, some analysts have noted that long-term holders of Bitcoin ceased selling their coins for the first time since July as of December 29—signaling potential stabilization among core investors.
Ted Pillows—a respected analyst—commented on this development stating that reduced selling pressure could signal an upcoming reversal: “Things are looking good for a relief rally here.”
This optimistic outlook was echoed by others within crypto circles:
“Bitcoin will bottom out soon,” said Crypto Caesar.“Relief rally is coming soon… Be ready.”
Technical Analysis: Bitcoin Price Movement
The daily chart shows Bitcoin forming a symmetrical triangle pattern starting mid-November 2023—a formation characterized by two converging trendlines creating a horizontal triangular shape which typically indicates consolidation before either an upward breakout or downward breakdown occurs.
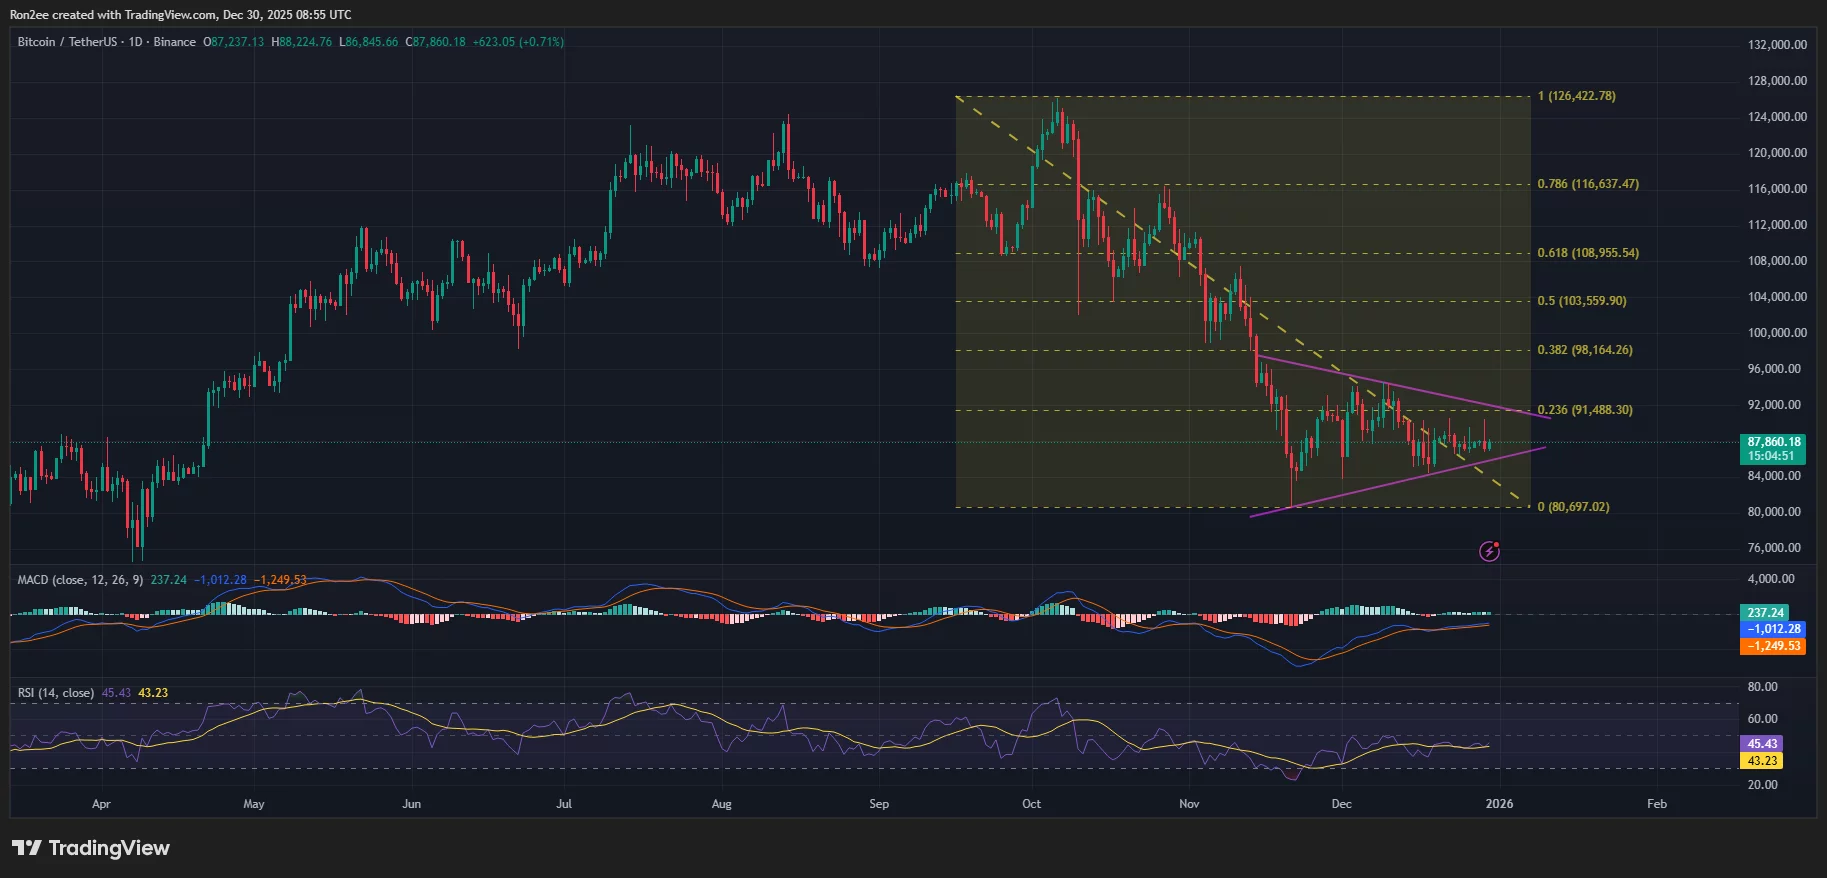
A breach below this lower trendline generally leads to further declines while breaking above it historically triggers strong bullish rallies.
At present (press time), BTC trades close to its lower boundary suggesting it is nearing a critical decision point.
Momentum indicators show slight positive shifts but mostly hover near neutral zones indicating ongoing consolidation.
Renewed inflows from institutions may act as catalysts driving structural recovery ahead.
Traders should monitor psychological support at roughly $86,000; falling beneath could push prices toward November lows near $82,175. Conversely resistance lies around $91,500, aligned closely with Fibonacci retracement levels derived between October highs and November lows.
You may also want to read: Whales withdrawing BTC from Binance amid mixed sentiment caused by leverage concerns & Schiff warnings
Please note: This article is intended solely for educational purposes and does not constitute financial advice or recommendations regarding investments whatsoever.