Bitcoin’s price movements often appear erratic when observed on shorter time intervals. Sudden surges, rapid retracements, and pronounced wicks frequently spark discussions among crypto enthusiasts and traders alike. While some attribute these patterns to market manipulation, others interpret them as legitimate trading signals. Ultimately, the perspective depends largely on the timeframe being analyzed.
Why Bitcoin Seems “Manipulated” on Short Timeframes
Within intraday charts, Bitcoin can swing by thousands of dollars in just a few hours. These intense fluctuations typically happen during:
- Periods with low liquidity
- Critical support or resistance levels
- Moments of funding rate adjustments or liquidation events
- The release of impactful news or macroeconomic triggers
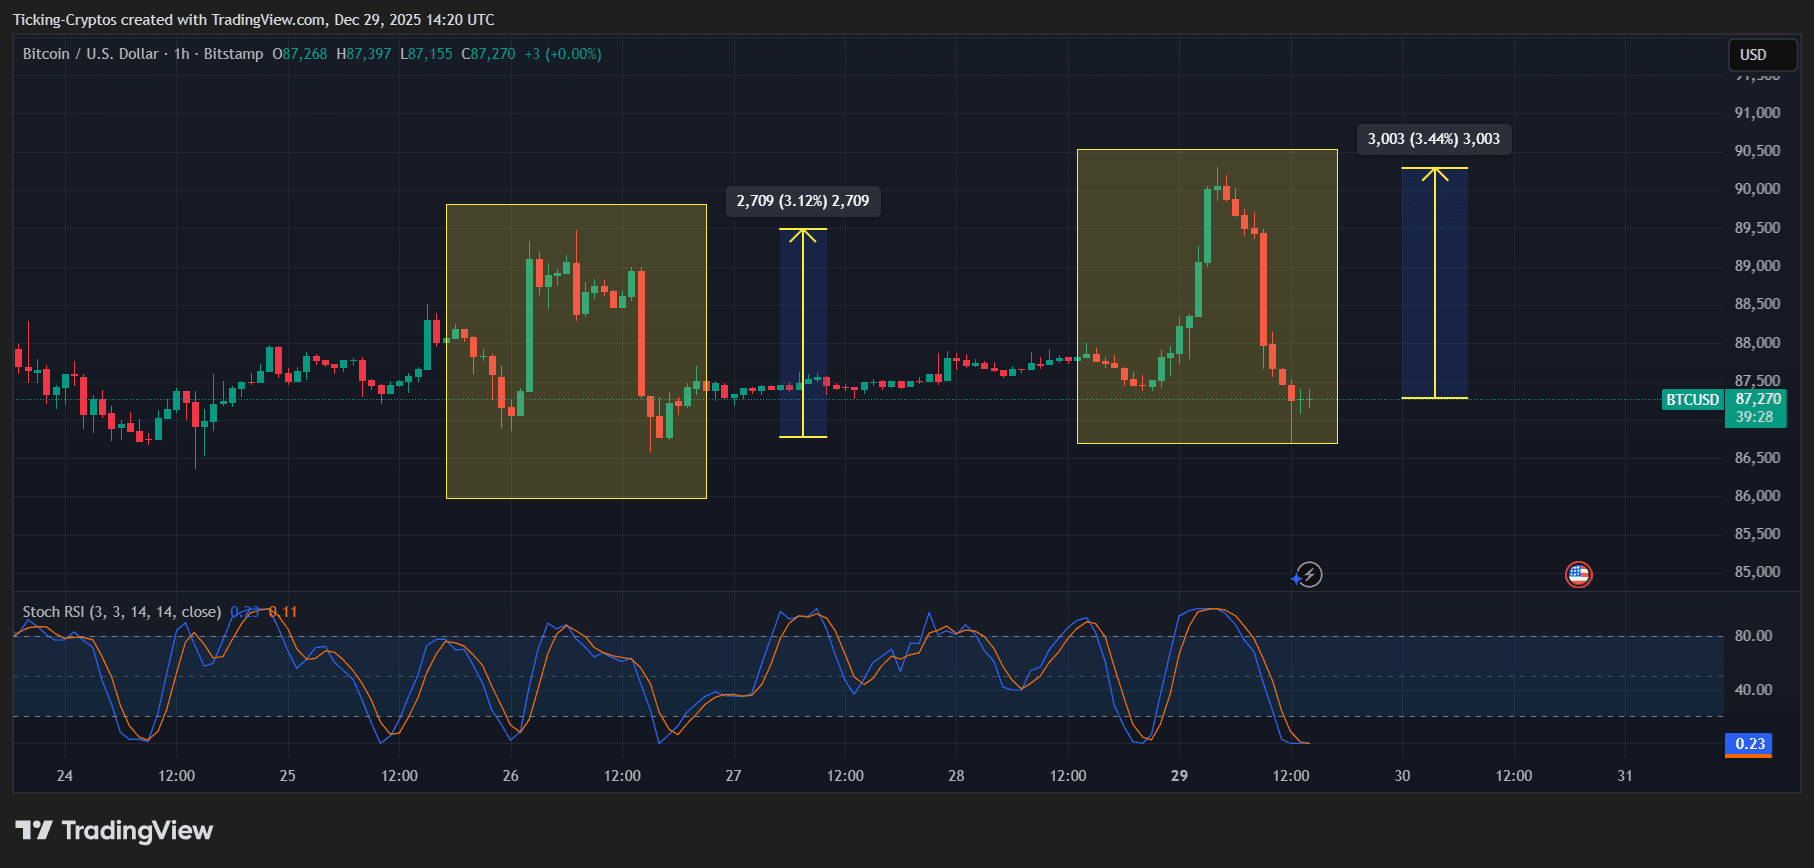
BTC/USD 1-Hour Chart – TradingView
The hourly chart above illustrates frequent rapid price shifts followed by swift reversals. For those holding long-term positions, such behavior may seem artificial or manipulated; however, active traders recognize these as liquidity hunts—where prices trigger stop-loss orders before stabilizing again.
This phenomenon is not exclusive to cryptocurrencies but is common across highly liquid markets dominated by leveraged derivative trading.
The Opportunity Seen by Traders Amid Volatility
Volatility isn’t an obstacle for short-term traders—it’s the essence of their strategy.
- Sizable moves provide clear points where trades become invalidated.
- A defined risk-to-reward ratio emerges from sharp price actions.
- Bounces within established ranges offer mean reversion opportunities.
- Maneuvers following liquidity sweeps create momentum-based plays.
During sideways markets, Bitcoin tends to fluctuate between well-defined highs and lows repeatedly presenting trade setups. What one participant perceives as manipulation might simply be structural market dynamics for another—the distinction lies primarily in investment horizon length.
A Broader Perspective: Insights from Daily Charts
Taking a step back to examine daily data reveals a contrasting picture:
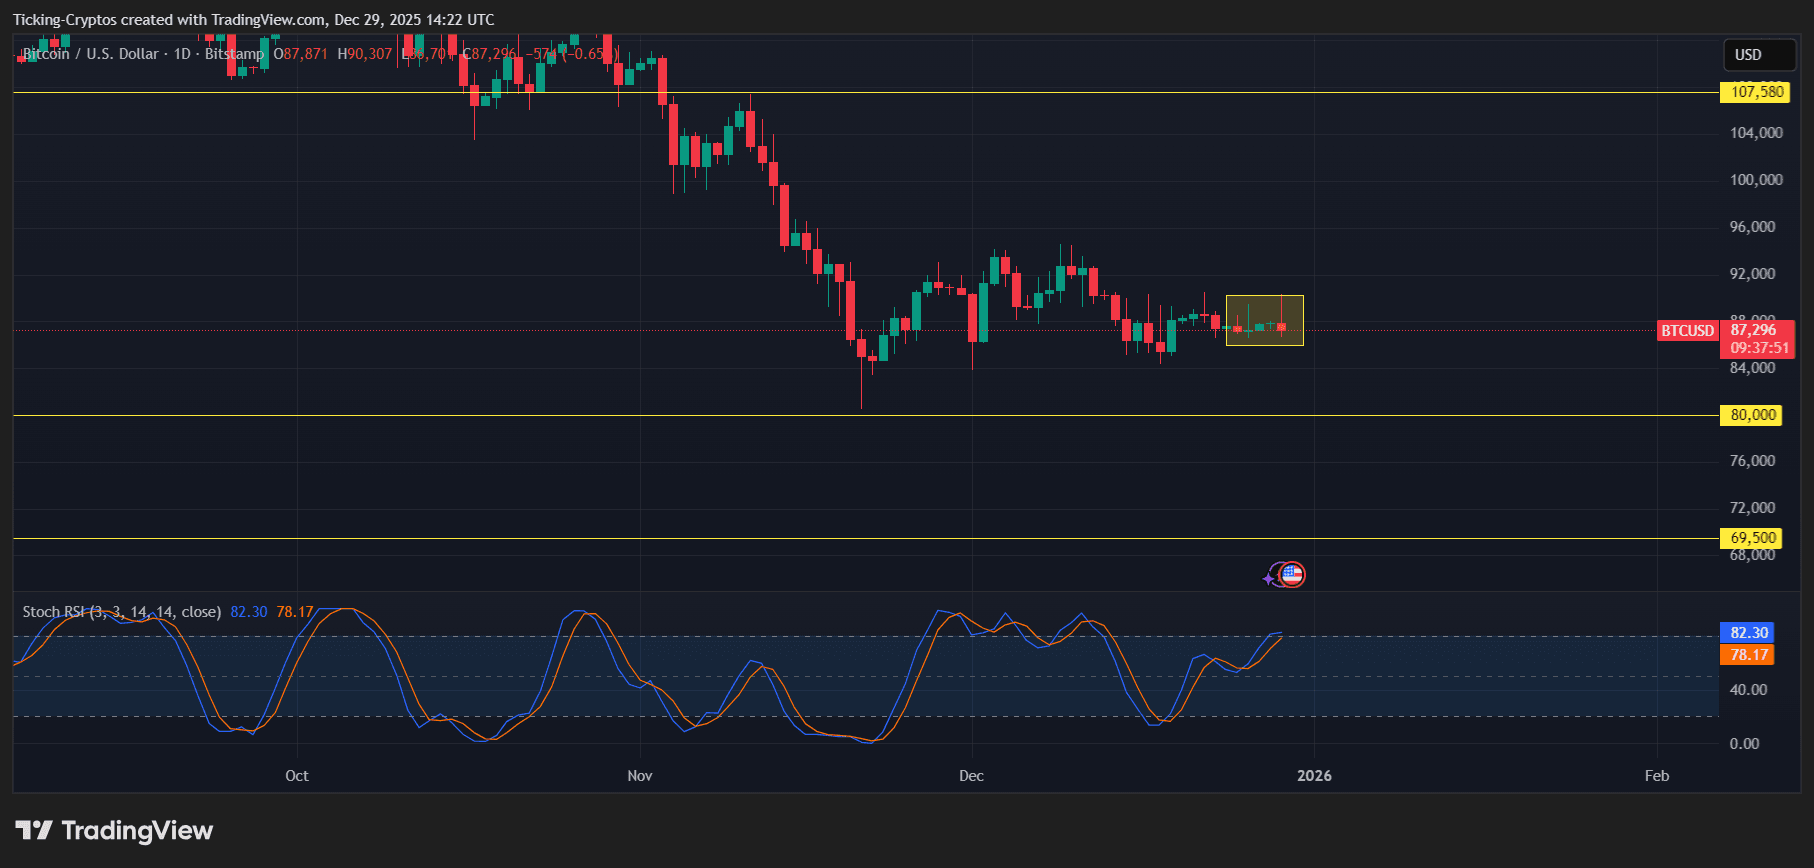
BTC/USD Daily Chart – TradingView
- A wider consolidation zone becomes apparent;
- Crisper macro-level support and resistance lines emerge;
- The pace of price movement slows down into more orderly trends;
- The noise caused by emotional reactions diminishes significantly;
The violent swings seen intraday barely register here—what looks like chaotic manipulation at lower resolutions often translates into healthy consolidation phases when viewed through this lens.
This explains why many long-term investors prioritize higher timeframes—not because volatility vanishes but because context improves dramatically.
Is Bitcoin Truly Manipulated?
No doubt bitcoin exhibits high volatility influenced heavily by leverage effects,
market sentiment,and varying liquidity conditions.But this doesn’t inherently equate
to deliberate manipulation.
- Short term charts tend to amplify random noise;
- Leverage magnifies price movements;
- Liquidity chases imbalances rather than fairness.
Understanding these factors helps reduce impulsive decisions based purely on emotion.
Bitcoin’s moves are far from random—they gravitate toward zones where liquidity resides.