Bitcoin is currently trading around $87,820, showing little change for the day and marking a decline of approximately 4% over the past month. Despite buyers stepping in at every price dip, each recovery attempt remains confined within a tight range. The chart reveals a clear explanation for these repeated stalls.
The core issue lies in what can be described as Bitcoin’s “unlucky 13” challenge. There exists a significant on-chain resistance level roughly 13% above the current market price. Until this barrier is surpassed, upward momentum struggles to gain traction.
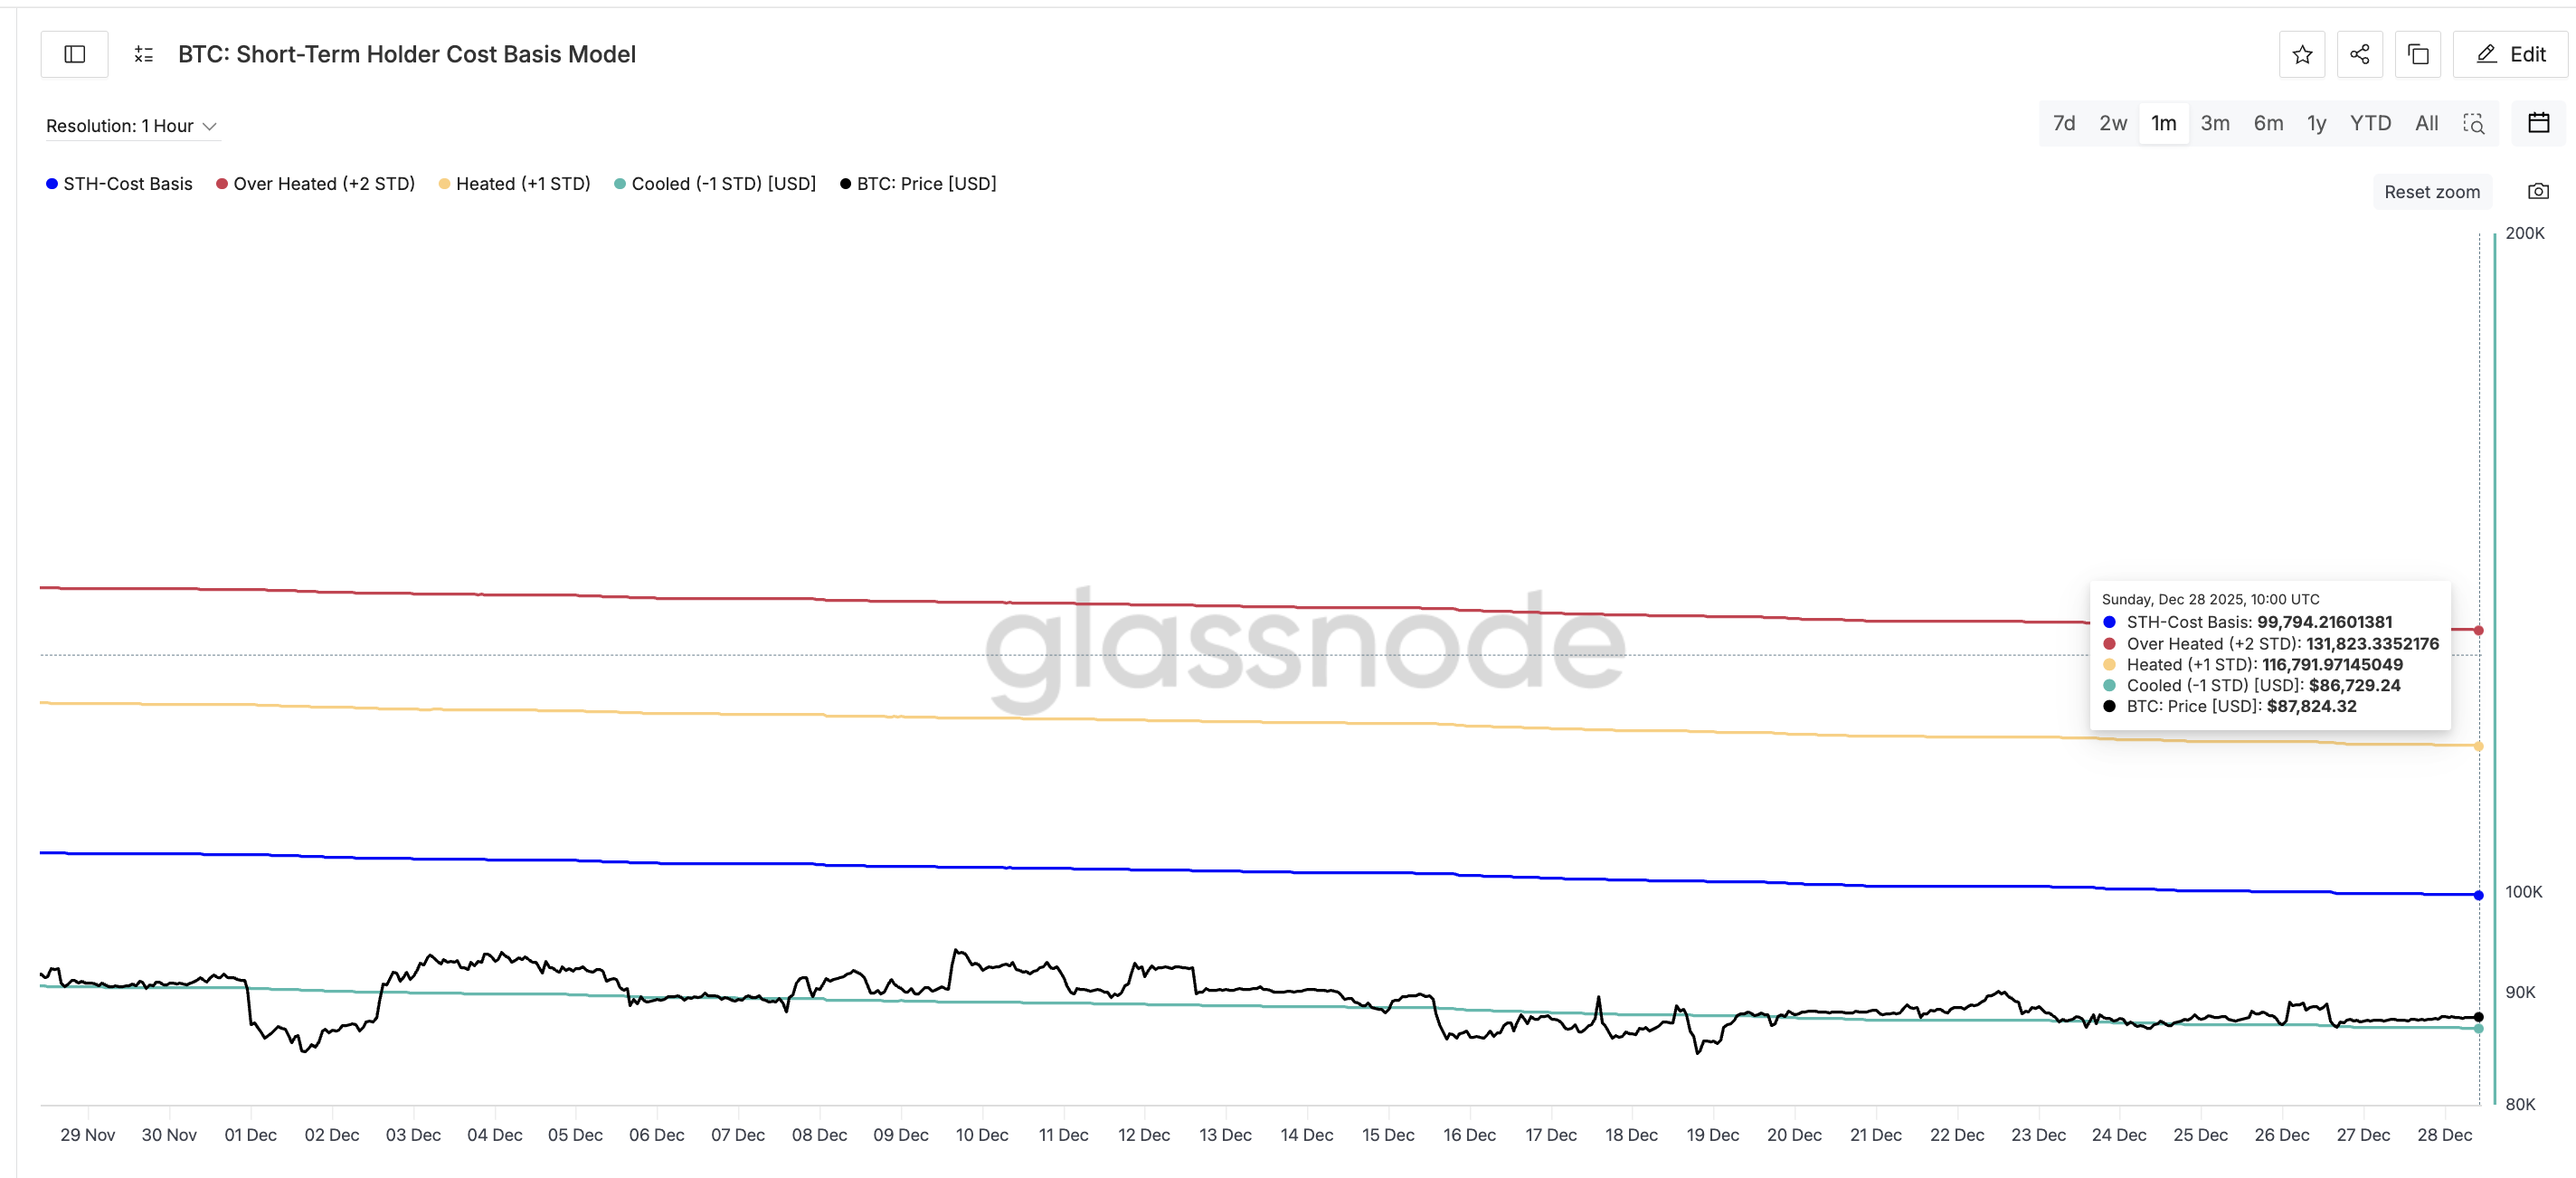
Short-Term Holders Create Resistance Through Their Cost Basis
Glassnode’s Short-Term Holder Cost Basis metric tracks the average purchase price of recent Bitcoin buyers. These short-term holders tend to react swiftly to market fluctuations; when prices fall below their entry points, they often sell to limit losses. This behavior generates an automatic selling pressure that acts like a ceiling on Bitcoin’s price chart.
At present, this cost basis stands near $99,790—about 13% higher than today’s spot price of $87,820—meaning most recent purchasers are holding at a loss. This dynamic explains why every rally loses steam before breaking out: sellers consistently emerge early to offload their positions.
If you want deeper insights like these into token trends, consider subscribing to Editor Harsh Notariya’s Daily Crypto Newsletter.
The HODL Waves indicator—which segments holders by how long they’ve kept their coins—supports this observation. The cohort holding between one day and one week shrank from 6.38% of total supply on November 27 down to just 2.13% by December 27. This suggests newer investors are selling rather than holding onto their assets, reinforcing resistance well before prices reach $99,790.

This makes the $99,790 level critical as near-term resistance for Bitcoin’s price action; however it should be noted that such on-chain levels are fluid and may shift with changes in spot pricing — so technical confirmation from charts is also necessary.
🔄
With spot hovering around $87.…
🔴 STH Cost Basis: $99.…
— Spot Price: $87.…
🏷 Active Investors Mean: $87.…
🏹 True Market Mean: $81.…
🔵 Realized Price: $56.…—amp;amp;amp;amp;amp;amp;; glassnode (@glassnode) December 28,á,2025
If Bitcoin manages to surpass this threshold comfortably again short-term holders would move back into profitability which likely halts forced selling pressures — easing supply constraints that have hindered previous rallies significantly.
Momentum Indicates Buyer Interest But Lacks Strength To Break Free
The twelve-hour chart shows Bitcoin consolidating inside what traders call a symmetrical triangle pattern—a formation created by converging lower highs and higher lows signaling indecision between bulls and bears alike—and awaiting breakout confirmation either way.
The Chaikin Money Flow (CMF) indicator measures whether substantial capital inflows or outflows dominate based on volume data relative to prices traded over time.
Currently rising alongside BTC but still beneath zero line indicates buying activity exists yet isn’t strong enough yet.
Hence momentum alone cannot push through upper trendline resistance within triangle boundaries just yet.
A CMF reading below zero means inflows aren’t sufficiently robust enough confirm sustained bullish trend strength so momentum fails break triangle ceiling .
Such hesitation reflects balance not tipping decisively toward buyers ; until CMF crosses above zero coupled with breakout beyond triangle , expect continued range-bound action constrained further due short term holder sales pressure .
Why The & quot ; Unlucky Thirteen & quot ; Barrier Matters In Price Levels
During late December , bitcoin has oscillated mostly between roughly$84 ,370and$90 ,540with every attempt nearing upper bound fading as underwater owners exit minimizing losses consistent directly with aforementioned short term cost basis ceiling .
For now roadmap appears simple : surpassing$94 ,600would indicate buyer progress while reclaiming$99 ,820 – close tothe earlier statedshort term holder cost basismark – breaks unlucky thirteen barrier allowing seller exhaustion resultingin bullish shiftforBTCpriceaction .

Beyond there,$107420becomes next target ifbuyers maintainmomentum otherwise supportat$84370 willbe criticalwhile dailyclosebelow80,$570confirmsbreakdown resettingJanuarytrendexpectationsextendinglowerrange furthermore .
This article originally appearedon BeInCrypto under title ' ;Bitcoin&squo;s ‘Unlucky13Problem’ Explained : Here&sWhy EveryPrice Bounce Keeps Failing'.