
As of December 20, 2025, Bitcoin’s value is recorded at $88,195, leading to a market capitalization of approximately $1.76 trillion. The trading volume over the past 24 hours stands at $37.07 billion. During this session, Bitcoin has maintained a defined intraday range between $86,929 and $88,759. This indicates an active market that is currently cautious rather than impulsive; in essence, Bitcoin is alert and moving about but hasn’t yet made a decisive choice between calm or chaos.
Bitcoin Chart Analysis
Looking at the hourly chart reveals that Bitcoin is caught in a phase of low volatility consolidation characterized by uncertainty rather than strong conviction. The price has fluctuated between roughly $88,000 and $89,500; however, an attempt to push towards $89,349 was quickly turned back—an example of a fleeting breakout lacking momentum.
The declining trading volume supports the notion that momentum appears to be on pause as traders await some form of catalyst instead of forcing directional moves. Such periods of compression typically do not last indefinitely; when they do resolve themselves it often occurs with significant movement.
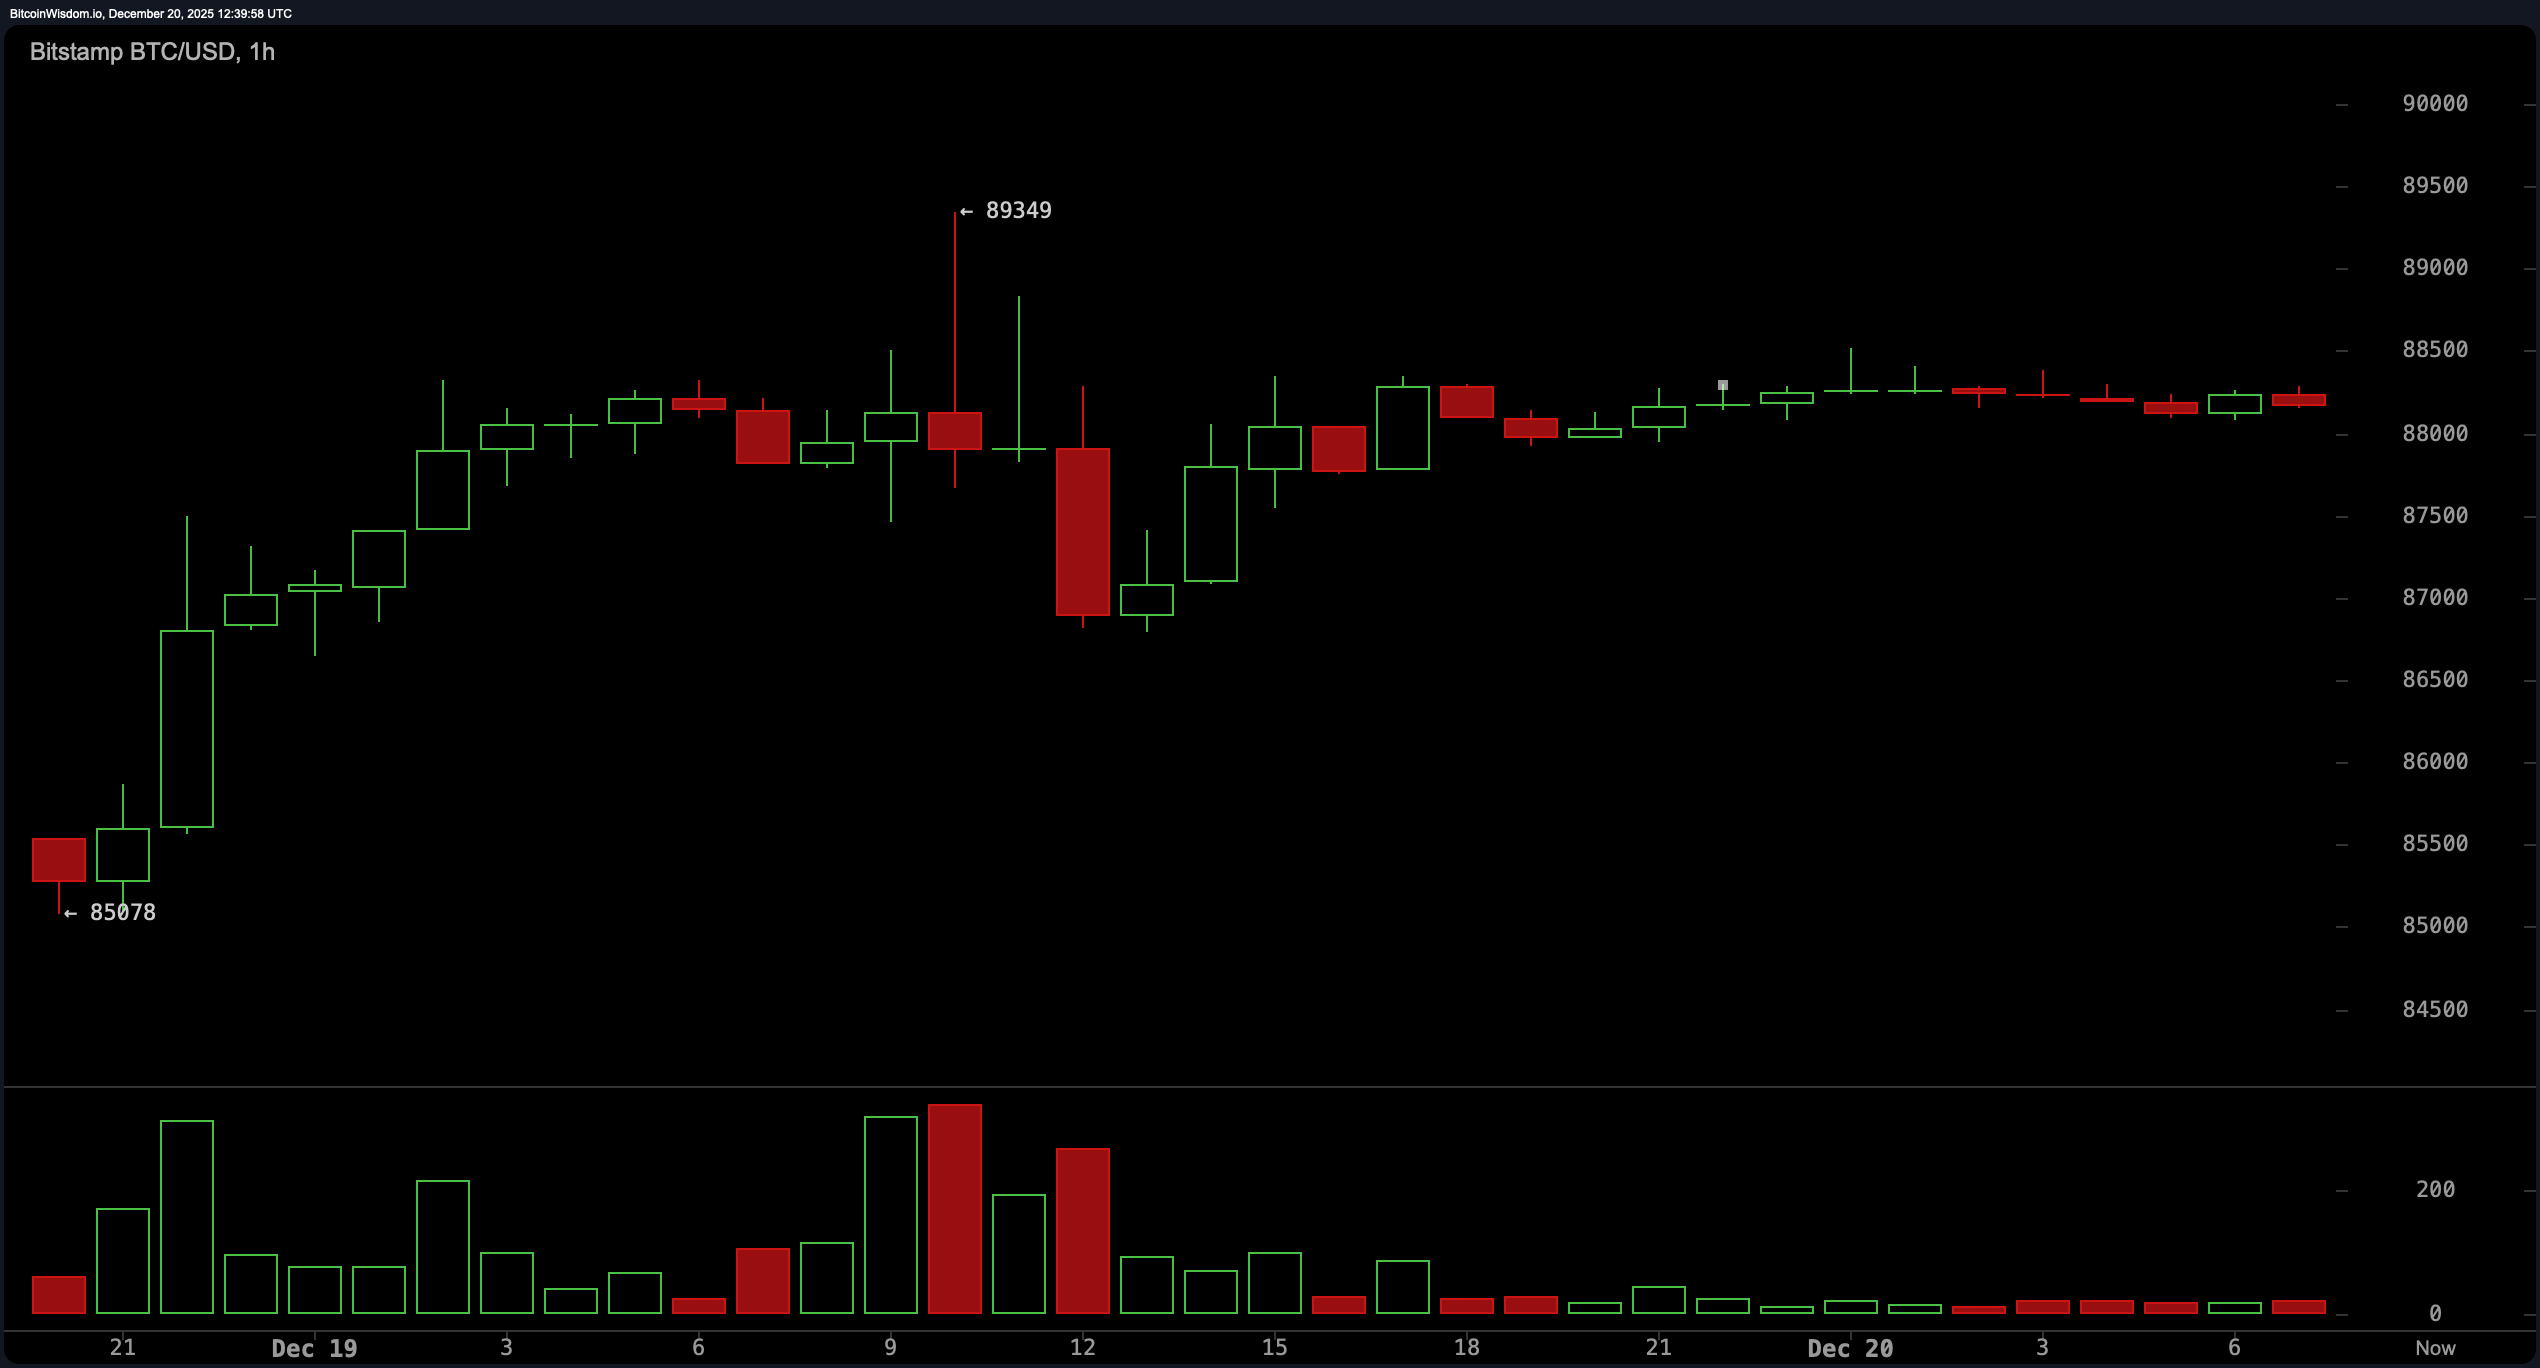
BTC/USD hourly chart via Bitstamp on December 20th.
If we expand our view to the four-hour chart perspective, we can see healthier structural dynamics after a sharp liquidity-driven decline found support around the level of $84,398. This point triggered a notable rebound accompanied by increased trading volume—a phenomenon often linked with capitulation and short-term exhaustion signals. Following this recovery phase shows steady progress as prices inch closer toward resistance near the zone around $90,317 where previous attempts were rejected.
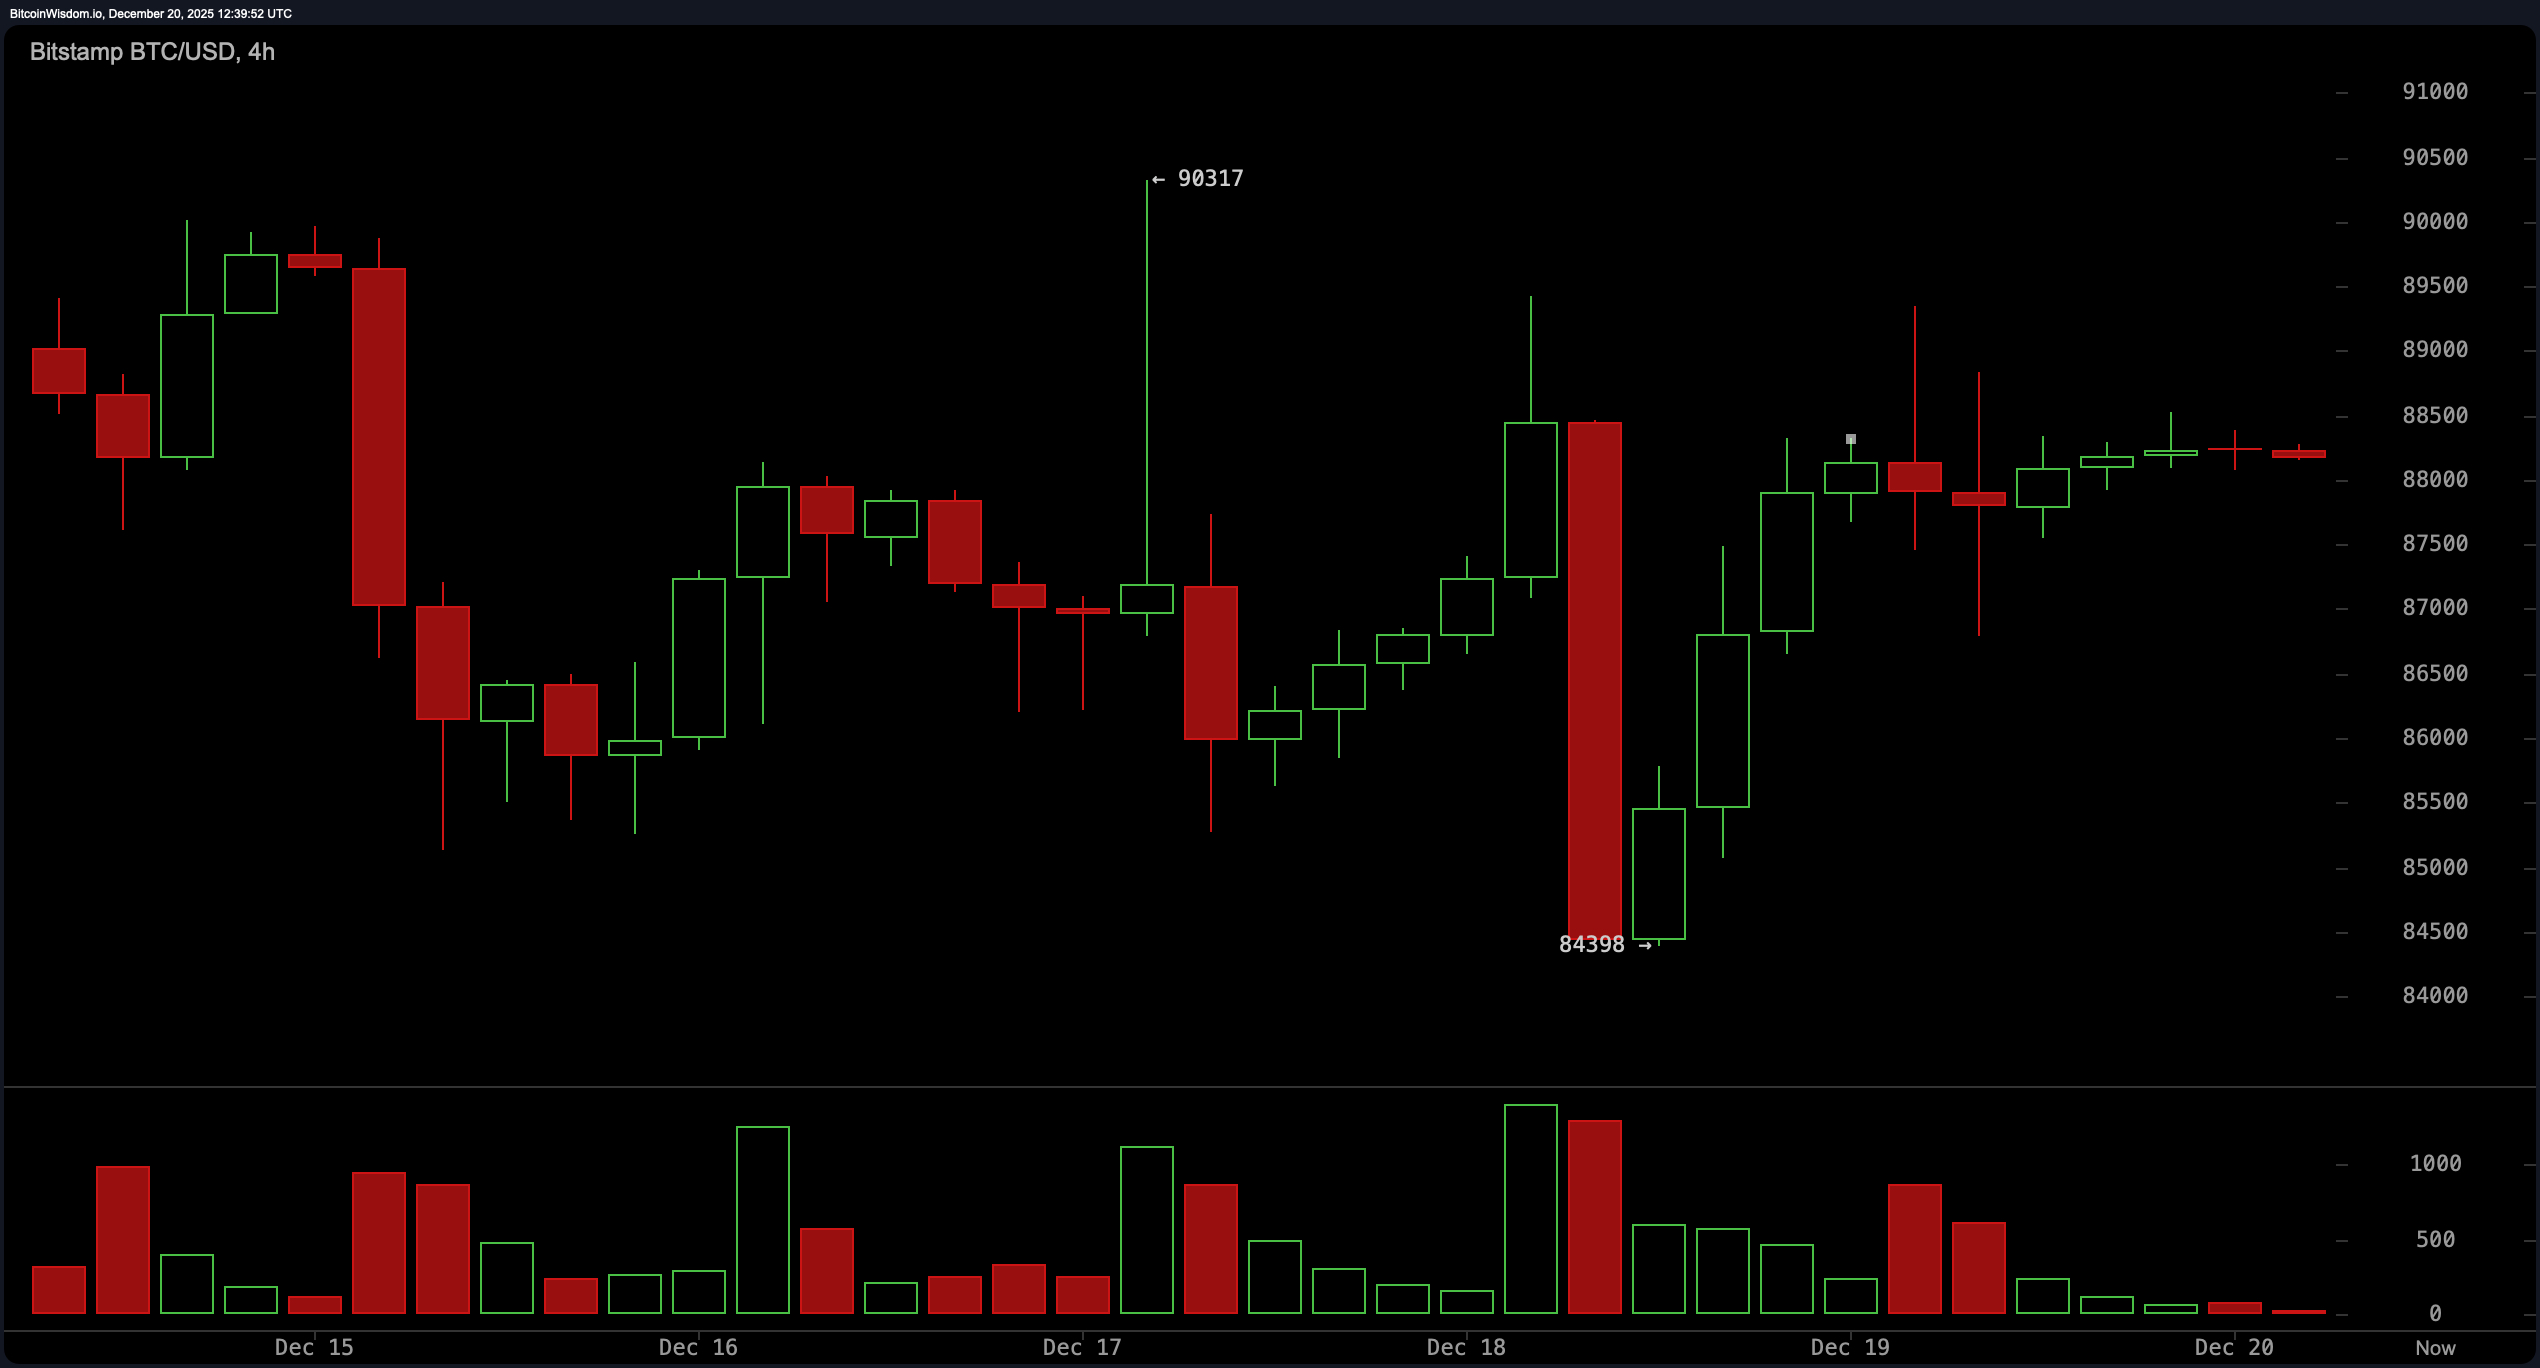
BTC/USD four-hour chart via Bitstamp on December 20th.
The daily chart provides additional context along with realistic expectations for Bitcoin’s trajectory as it continues its journey out from an overarching downtrend which saw prices fall from approximately $96K into the high-$80K range. A significant lower wick forming near$80K marks an essential turning point followed by improved price action stabilizing around levels between$87K-$88K range while volumes remain elevated indicating recovery responses rather than further declines suggesting long-term players might be quietly accumulating positions amidst louder headlines.
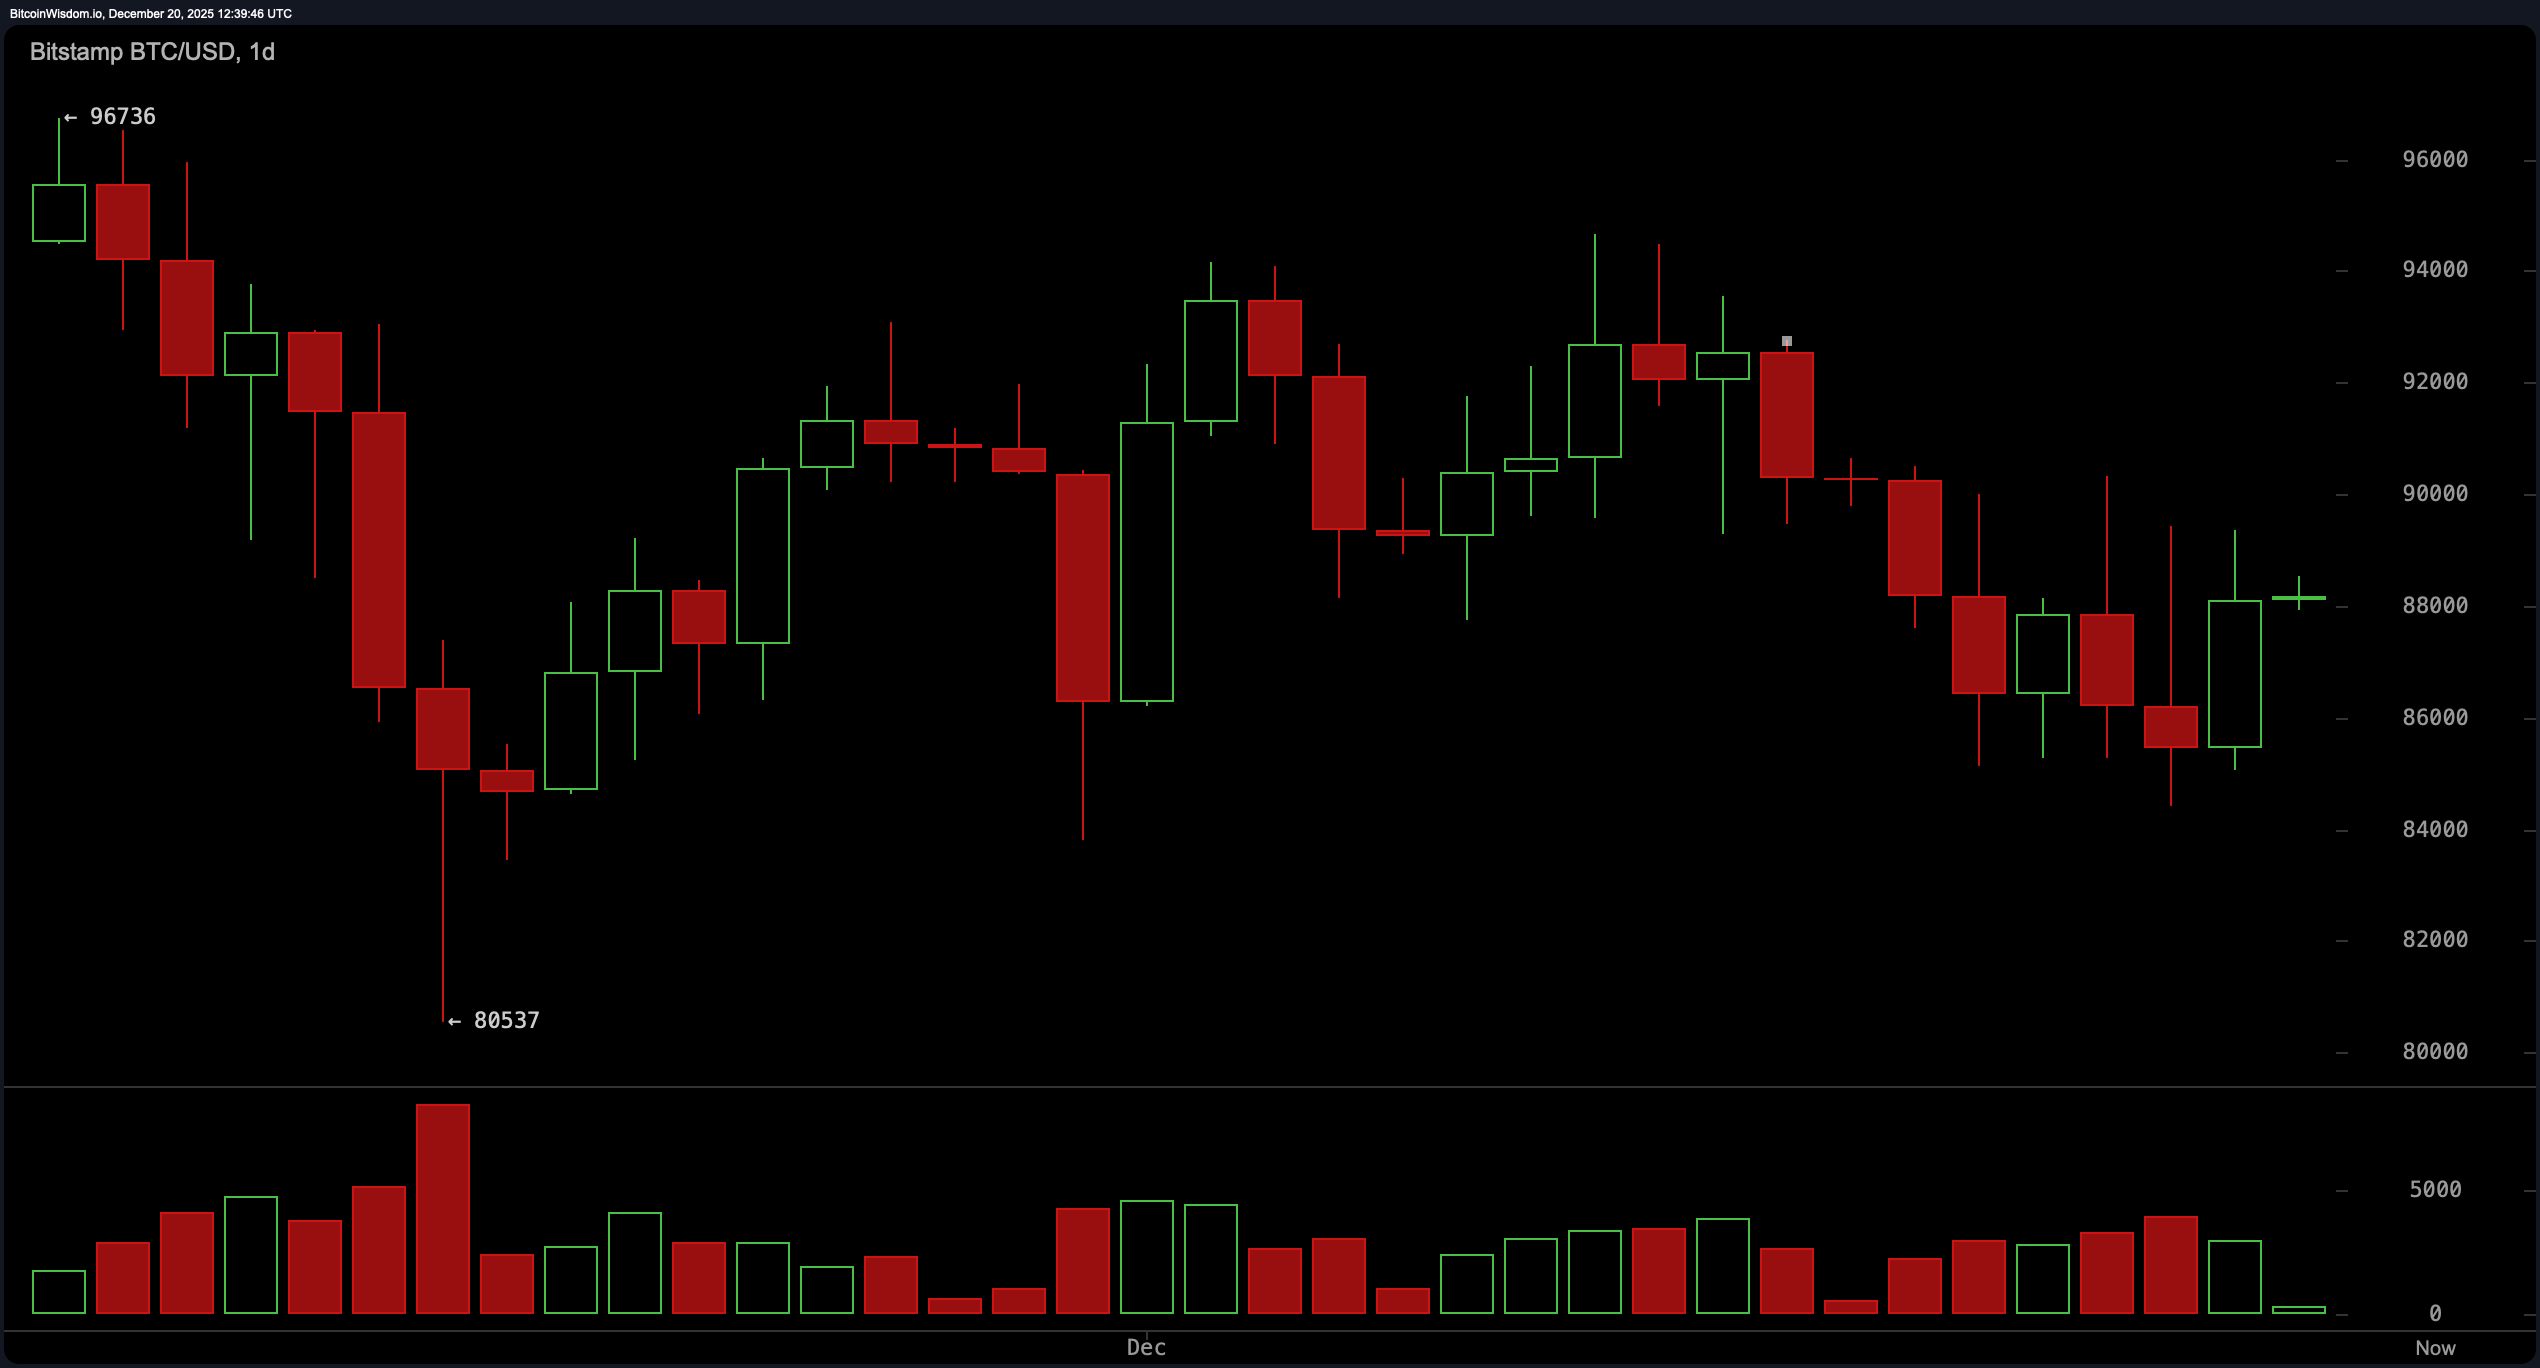
BTC/USD daily chart via Bitstamp on December 20th.
Momentum indicators present mixed signals but offer valuable insights into current conditions: The relative strength index (RSI) sits at44 while Stochastic reads28 along with commodity channel index (CCI) measuring -53; average directional index (ADX) rests at26—all indicating neutral territory without any dominant trend emerging clearly yet! Meanwhile Awesome oscillator remains negative although metrics like momentum(10)and MACD histogram show signs pointing towards internal pressure building despite overall hesitance within pricing movements—this divergence tends intrigue technicians even if keeping short-term traders anxious!
On another note regarding moving averages(MAs), they act more like strict overseers here since prices are consistently below both exponential moving average(EMA)&simple moving average(SMA)—from shortest EMA($88k approx.)to longer spans reaching up till200-period SMA($108k approx.). Such alignment reinforces broader corrective structures signaling any upward attempts would require persistence overcoming layered resistances ahead! Although flirting recovery possibilities exist still long term trends aren’t ready call comeback tour just yet!
Bullish Perspective:
The current situation suggests early indications toward structural improvement instead outright bullishness though groundwork being laid down subtly observed through rebounds witnessed within4-hour charts originating off areas surrounding$84k coupled alongside enhancing momentum(10)&constructive MACD histograms hinting downside pressures easing significantly over timeframes considered here now too! Daily charts carving bases lying somewhere between87-88k levels combined volumes supporting recoveries opposed continuations lower makes markets appear increasingly comfortable absorbing supplies flowing through their veins presently speaking! Should consolidations break upwards eventually—it’ll signify patience winning arguments against panic prevailing earlier times indeed!
Bearish Perspective:
Despite underlying improvements visible beneath surface-level analysis done so far—Bitcoin finds itself technically restrained under walls composed overhead resistances stacked upon declining MAs throughout all major EMAs/SMA ranges spanning ten-period right up until two-hundred period intervals maintaining defensive stances firmly intact across board altogether still ! Neutral readings seen across RSI/Stochastic CCI&ADX affirm lack convictions building upwards whatsoever henceforth until higher reclaimed decisively risks remain prevalent cautioning traders hesitations could lead them astray ultimately cutting both ways alike .
Frequently Asked Questions
What’s bitcoin’s current valuation dated Dec.,20 th ,2025?
At present moment ,bitcoin trades for about eighty-eight thousand one hundred ninety-five dollars ($88195), remaining confined within narrow intraday ranges reflecting consolidation patterns versus trending confidence overall
Why does bitcoin hover close around eighty-eight thousand dollars?
Current compressions occurring result mainly due neutralized momentum indicators alongside dwindling volumes indicating indecisiveness among participants awaiting potential breakouts forthcoming soon enough perhaps?
What insights do technical indicators provide regarding bitcoin presently?
Most oscillators including RSI &Stochastics indicate neutrality whilst Momentum(10)&MACD showcase initial improvements internally even amid pricing hesitancies observed recently thus far…
Which key levels should traders keep eyes peeled onto concerning bitcoins performance ?
Traders focus closely upon resistance zones nearing values approaching ninety-thousand dollars ($90000 )and structural supports existing mid-eighty-thousands based off recent behaviors exhibited across various charts analyzed thoroughly .