
While Bitcoin’s recent drop below the $90,000 mark may seem alarming on the surface, it is more accurately described as a measured correction rather than a complete breakdown of its trend. The cryptocurrency has found some stability in the mid-to-high $80,000 range, where liquidity dynamics, derivative positions, and spot market demand are starting to realign after a significant sell-off from levels between $100,000 and $105,000.
Monitoring Key Levels
The first critical zone to watch lies between $83,500 and $85,000. This area stands out on the liquidation heatmap as a concentrated liquidity zone that has previously acted as a support level. During the recent downturn, buyers stepped in decisively here to absorb forced liquidations and maintain price stability.
As long as Bitcoin manages to close consistently above this threshold, any downward momentum will likely diminish. Conversely, if it breaks below this range clearly and decisively again without immediate recovery signs—further declines could become possible; however currently there’s no evidence supporting such an outcome.
Bitcoin’s Consolidation Phase
The second major focal point is Bitcoin’s current consolidation phase occurring between $86,500 and $87,000. This segment represents short-term equilibrium with enough absorption capacity to prevent drastic drops while also providing adequate liquidity for price fluctuations.
A third important level exists higher up—between $90,800 and $91,500—where unfulfilled orders from earlier breakdowns remain plentiful alongside resting liquidity. This region presents itself clearly as an upside target based on market mechanics.
If Bitcoin can reclaim and hold within the range of approximately $88 ,500-$89 ,000 then pushing towards around$91 , 000 transitions from being merely optimistic speculation into an almost mechanical outcome driven by behavior seeking out available liquidity.
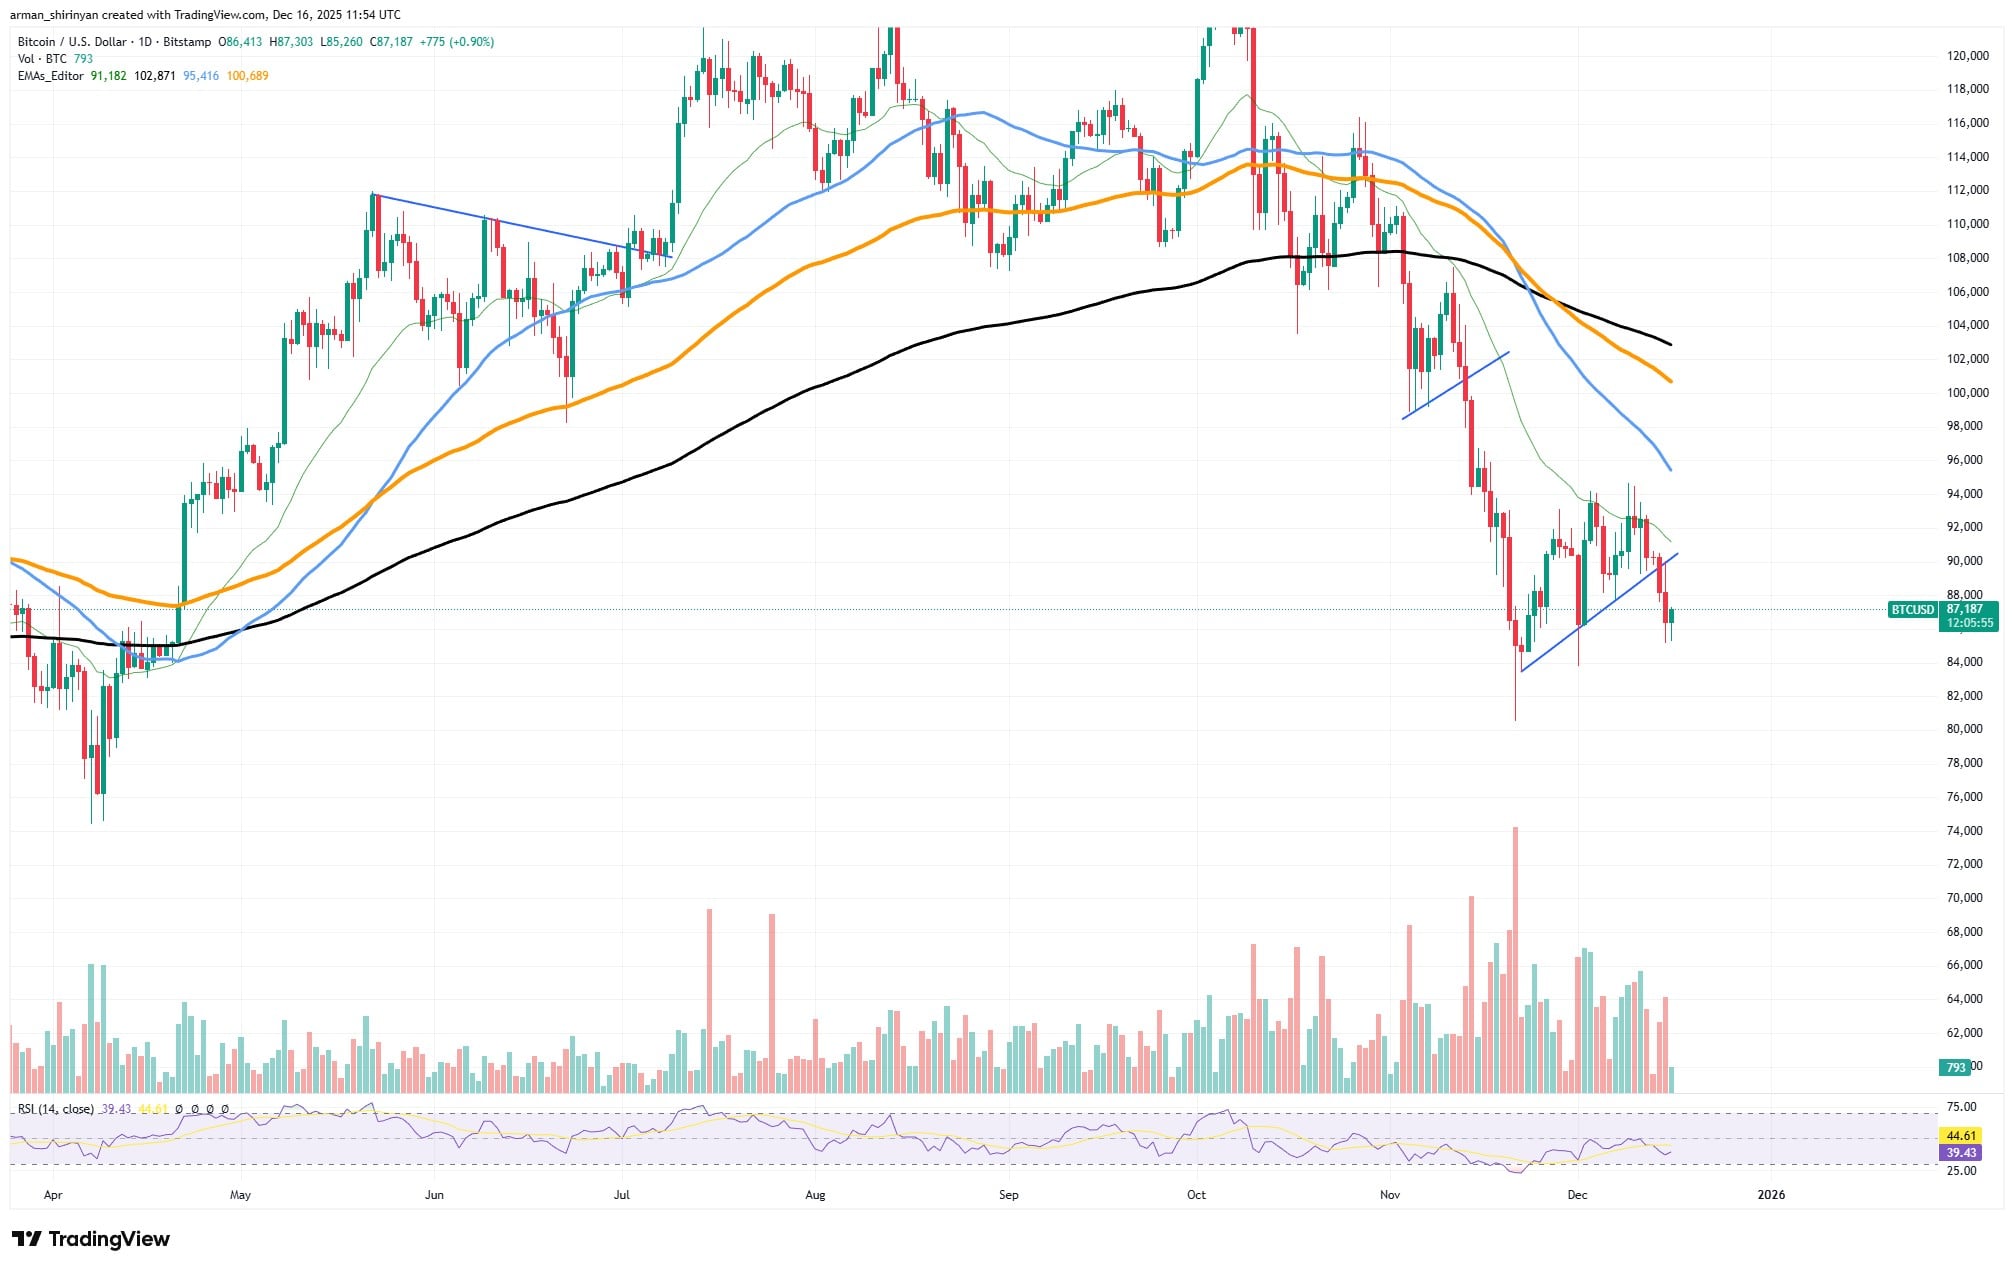
Looking at broader trends reveals that while damage has occurred recently—it hasn’t completely shattered previous structures; leverage was flushed out instead of long-term holders exiting their positions altogether—the overall structure remains elevated compared with past cycle peaks—and importantly—the 200-day moving average continues intact.