Bitcoin (BTC) remains within its recent consolidation range, trading near the $90,000 mark as of Friday. Investors are carefully analyzing the Federal Reserve’s cautious approach to its December interest rate cut and what this means for risk assets.
The price of BTC is nearing a crucial descending trendline that may dictate its next move. Meanwhile, institutional investments in Spot Bitcoin ETFs have shown modest inflows, and Strategy Inc. has increased its Bitcoin holdings in their treasury.
The Fed’s Conservative Stance Spurs Bitcoin Consolidation
Bitcoin began the week positively, extending gains from the weekend and maintaining levels above $92,600 on Tuesday.
However, momentum slowed by Wednesday when BTC closed at $92,015 following the Federal Open Market Committee (FOMC) meeting.
The Fed reduced interest rates by 25 basis points as expected but hinted at a probable pause in January’s policy adjustments.
Additionally, policymakers forecasted only a quarter-point rate cut for 2026—unchanged since September—dampening expectations for multiple cuts and exerting short-term pressure on risk assets.
This cautious tone from the Fed combined with underwhelming earnings reports from Oracle triggered a brief risk-off sentiment among investors.
Consequently, Bitcoin dipped to around $89,260 before recovering to close above $92,500 on Thursday.
With no significant US economic data scheduled soon, crypto markets will look toward speeches from FOMC members and overall market sentiment for guidance heading into week’s end.
Barring any major catalysts emerging shortly, BTC is expected to remain range-bound in the near term.
Geopolitical Tensions Between Russia and Ukraine Curb Risk Appetite
Tensions persist as US President Donald Trump expressed “extreme frustration” over Russia-Ukraine issues with no desire for further negotiations according to his spokesperson on Thursday.
Earlier statements by Ukrainian President Volodymyr Zelenskyy accused the US of pressuring Ukraine into ceding territory to Russia as part of peace talks aimed at ending nearly four years of conflict.
This ongoing geopolitical uncertainty alongside stalled diplomatic efforts continues suppressing global risk appetite which contributes to Bitcoin’s current consolidation phase this week.
Mild Uptick Observed in Institutional Demand
A slight improvement has been noted in institutional demand for Bitcoin recently.
Data from SoSoValue indicates that US-listed spot Bitcoin ETFs experienced net inflows totaling approximately $237.44 million through Thursday after seeing outflows worth about $87.77 million just one week prior—signaling somewhat renewed investor interest among institutions.
Despite these positive signs , weekly ETF inflows remain relatively small compared with mid-September levels . For sustained recovery , stronger ETF investment activity would be necessary .
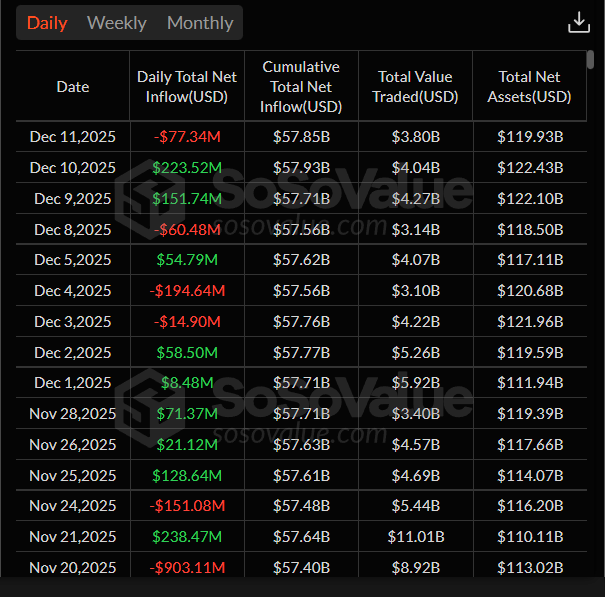
Total bitcoin spot etf net inflow chart . source : sosovalue
On corporate developments , Strategy Inc . ( MSTR ) revealed it acquired 10 , 624 bitcoins valued at roughly $962 .7 million between december 1 -7 averaging about $90 ,615 per coin .
The company now holds approximately 660 ,624 btc worth an estimated value exceeding $49 billion while retaining ample capacity raising capital potentially enabling further large-scale bitcoin accumulation efforts .
Easing Selling Pressure Reflected In On-Chain Metrics
According to CryptoQuant ’s weekly analysis released wednesday , selling pressure affecting bitcoin appears to be diminishing gradually .
The report highlights decreased exchange deposits indicating that major holders have scaled back transfers onto exchanges recently .
The data shows large players’ share of total deposits dropped significantly—from an average peak of 47% during mid-November down to just 21% by Wednesday—with average deposit sizes falling roughly 36%, moving from around 1.1 BTC late November down towards approximately 0.7 BTC currently.
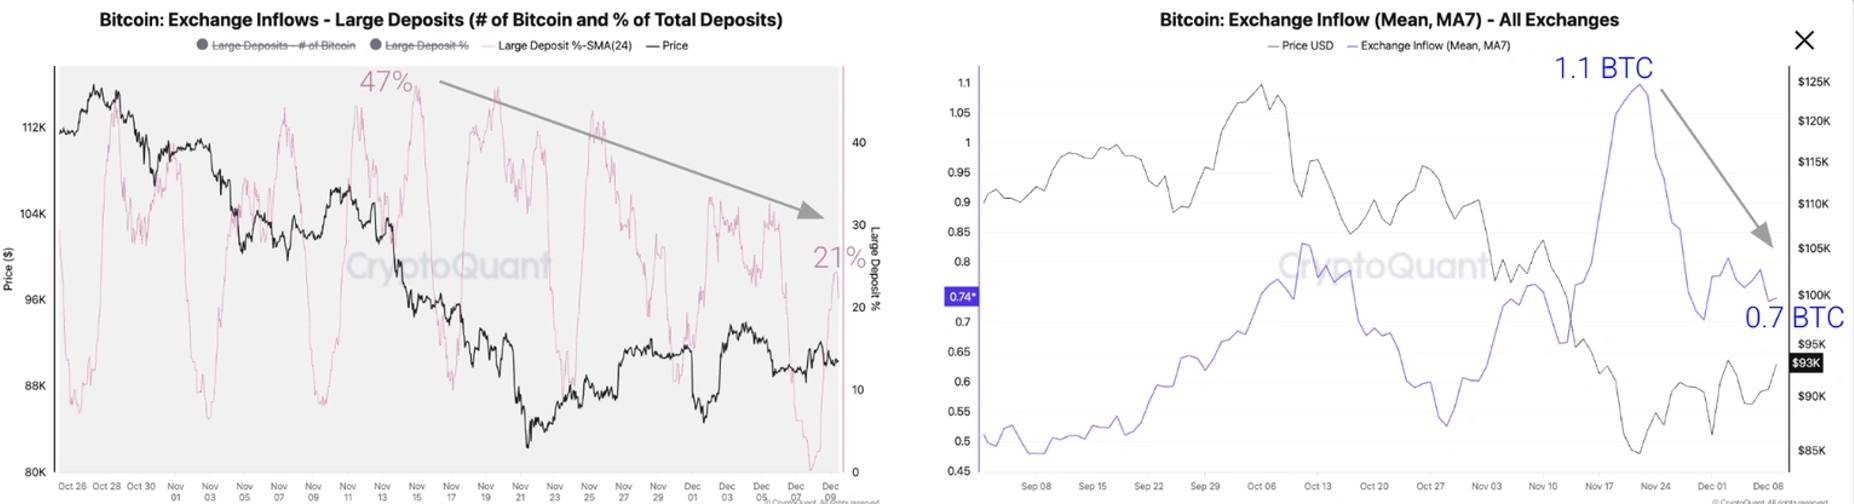
bitcoin exchange flows . source: cryptoquant
If selling pressure stays subdued going forward,a relief rally could propel bitcoin prices back up towards$99&comma000.
This level corresponds withthe lower boundaryof Trader On-chain Realized Price bands, a resistance commonly encountered during bearish phases.
Beyond this point&comma key resistances lieat$102&comma000 (one-year moving average) and$112&comma000(Trader On-chain Realized Price).
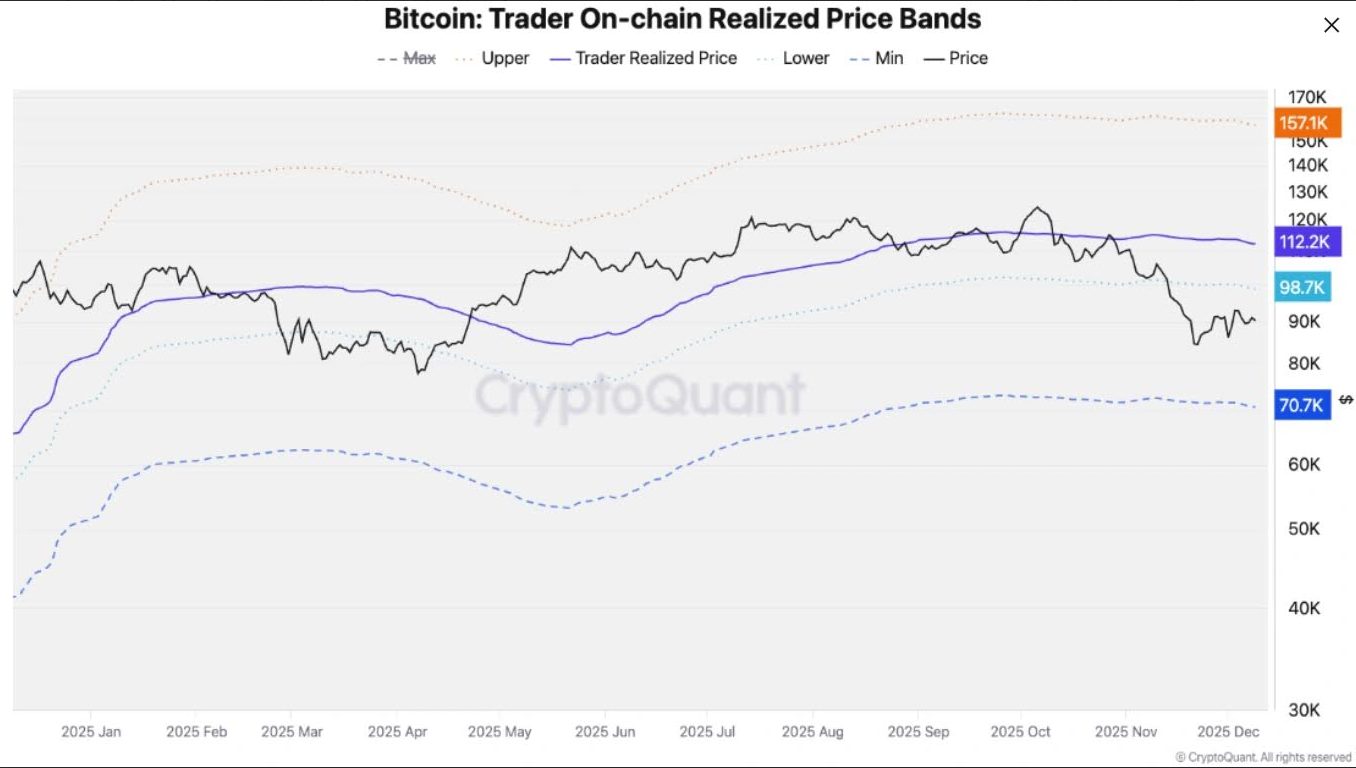
Bitcoin Trader’s Realized Price Bands
Copper Research also expresses optimism regarding bitcoin’s outlook.
Their report suggestsbtc’s traditional four-year cycle hasn’t ended but rather evolved.
An observable pattern since spot etfs launched involves recurring cost-basis return cycles illustrated below.
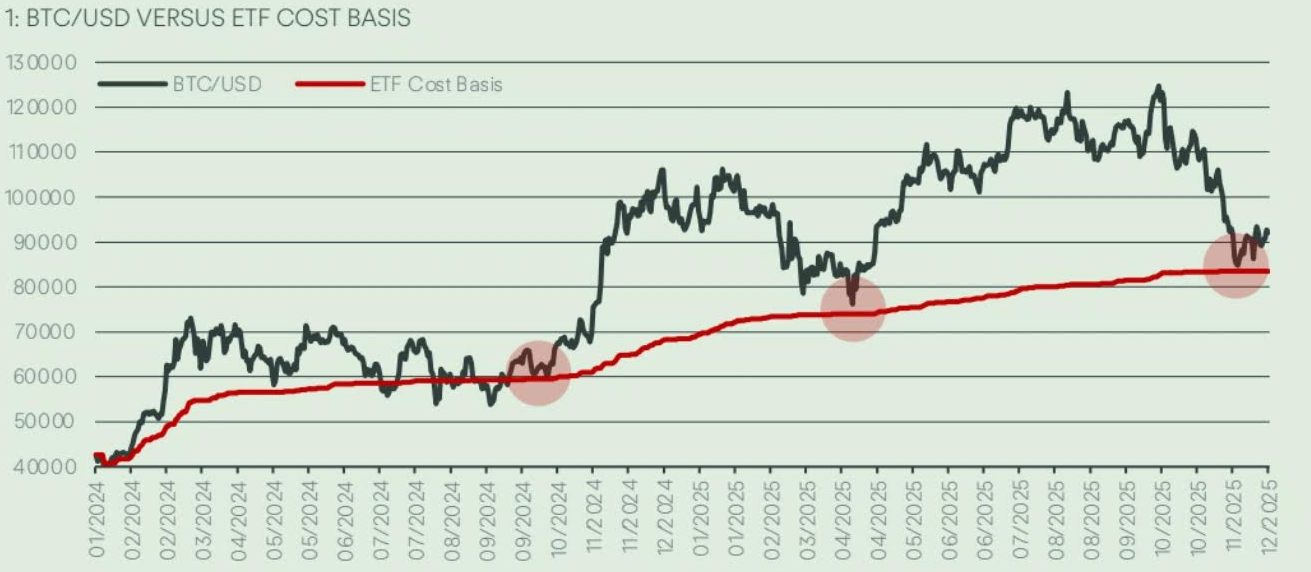
Bitcoin USD Price Vs ETF Cost Basis
Copper’s Head Of Research,Fadi Aboualfa,told FXStreet:&ldquoSince spot ETFs debuted,BTC has followed repeatable mini-cycles where it retraces backto cost basis then rebounds roughly70%.&rdquo
&ldquoWith current trading nearits ~$84&comma000 cost basis,this implies potential upside beyond$140&comma000 within six months.&rdquo
&ldquoIfcost bases increase10–15%,similar top premiums seen previously suggest targets between$138&comma000and$148&comma000.&rdquo
A Potential Santa Rally For Bitcoin?
NOVEMBER saw BITCOIN suffer A SIGNIFICANT LOSS OF17&period67% WHICH DISAPPOINTED TRADERS WHO HAD EXPECTED A RALLY BASED ON ITS HISTORICALLY STRONG RETURNS FOR THE MONTH ACCORDING TO COINGLASS DATA BELOW.
Historically,
December tends To Be Positive For The Leading Cryptocurrency With An Average Return Of Approximately4&period55%.
Quarterly Data Indicates That Q4 Has Been Generally The Best Quarter For BTC Averaging Returns Around77&period38% But So Far This Year It Has Posted A Loss Of19 Percent In Last Three Months
<H3 id = & quot ; Is-BTC-Bottoming-Out? & quot ; & gt ;
& lt;p> ;
Weekly Charts Show Support Near100 Week EMA At Roughly85,& nbsp809 With Two Consecutive Green Candles After Four Weeks Correction Since Late October.
BTC Currently Trades Slightly Above92000 Level And Could Extend Gains Towards50 Week EMA Around99182 If Recovery Continues.
RSI Reading Near40 Shows Decreasing Bearish Momentum While Sustained Rally Would Require RSI Crossing Neutral50 Level Upwards.
Daily Chart Reveals Rejection At61 Point Eight Percent Fibonacci Retracement Around94253 Followed By Bounce Off Psychological90000 Support Level.
Breaking Above Descending Trendline From Early October Highs And Closing Over94253 Resistance May Propel Rally Toward100K Psychological Barrier.
MACD Bullish Crossover Remains Intact Supporting Positive Outlook Though Daily RSI Stability Near Neutral Indicates Lack Of Immediate Momentum Either Way.
Key Downside Support Lies Near85569 Corresponding To78 Point Six Percent Fibonacci Retracement If Correction Resumes.
Post By BeInCrypto;, “Bitcoin Weekly Forecast: Fed Delivers Yet Fails To Impress Traders”, appeared first on BeInCrypto.
.