
Bitcoin strutted into the market spotlight today with a price tag of $113,171, a market cap flex of $2.25 trillion, and a 24-hour trading volume clocking in at $67.17 billion. With intraday swings from $112,249 to $116,041, bitcoin isn’t just moving—it’s tangoing between tension and temptation.
Bitcoin Chart Outlook
Let’s talk big picture—on the daily chart, bitcoin is recovering from a sharp tumble after flirting with $126,272. That “double top” left scars, dragging the price down to a gritty $103,530 before bouncing back into a tepid consolidation range between $113,000 and $114,000.
Volume tells the real story here: fierce during the fall, weak on the way up. Traders are nibbling, not biting. With resistance lounging at $116,000–$117,000 and psychological support hugging $110,000, bitcoin’s current level feels more like a waiting room than a launchpad.
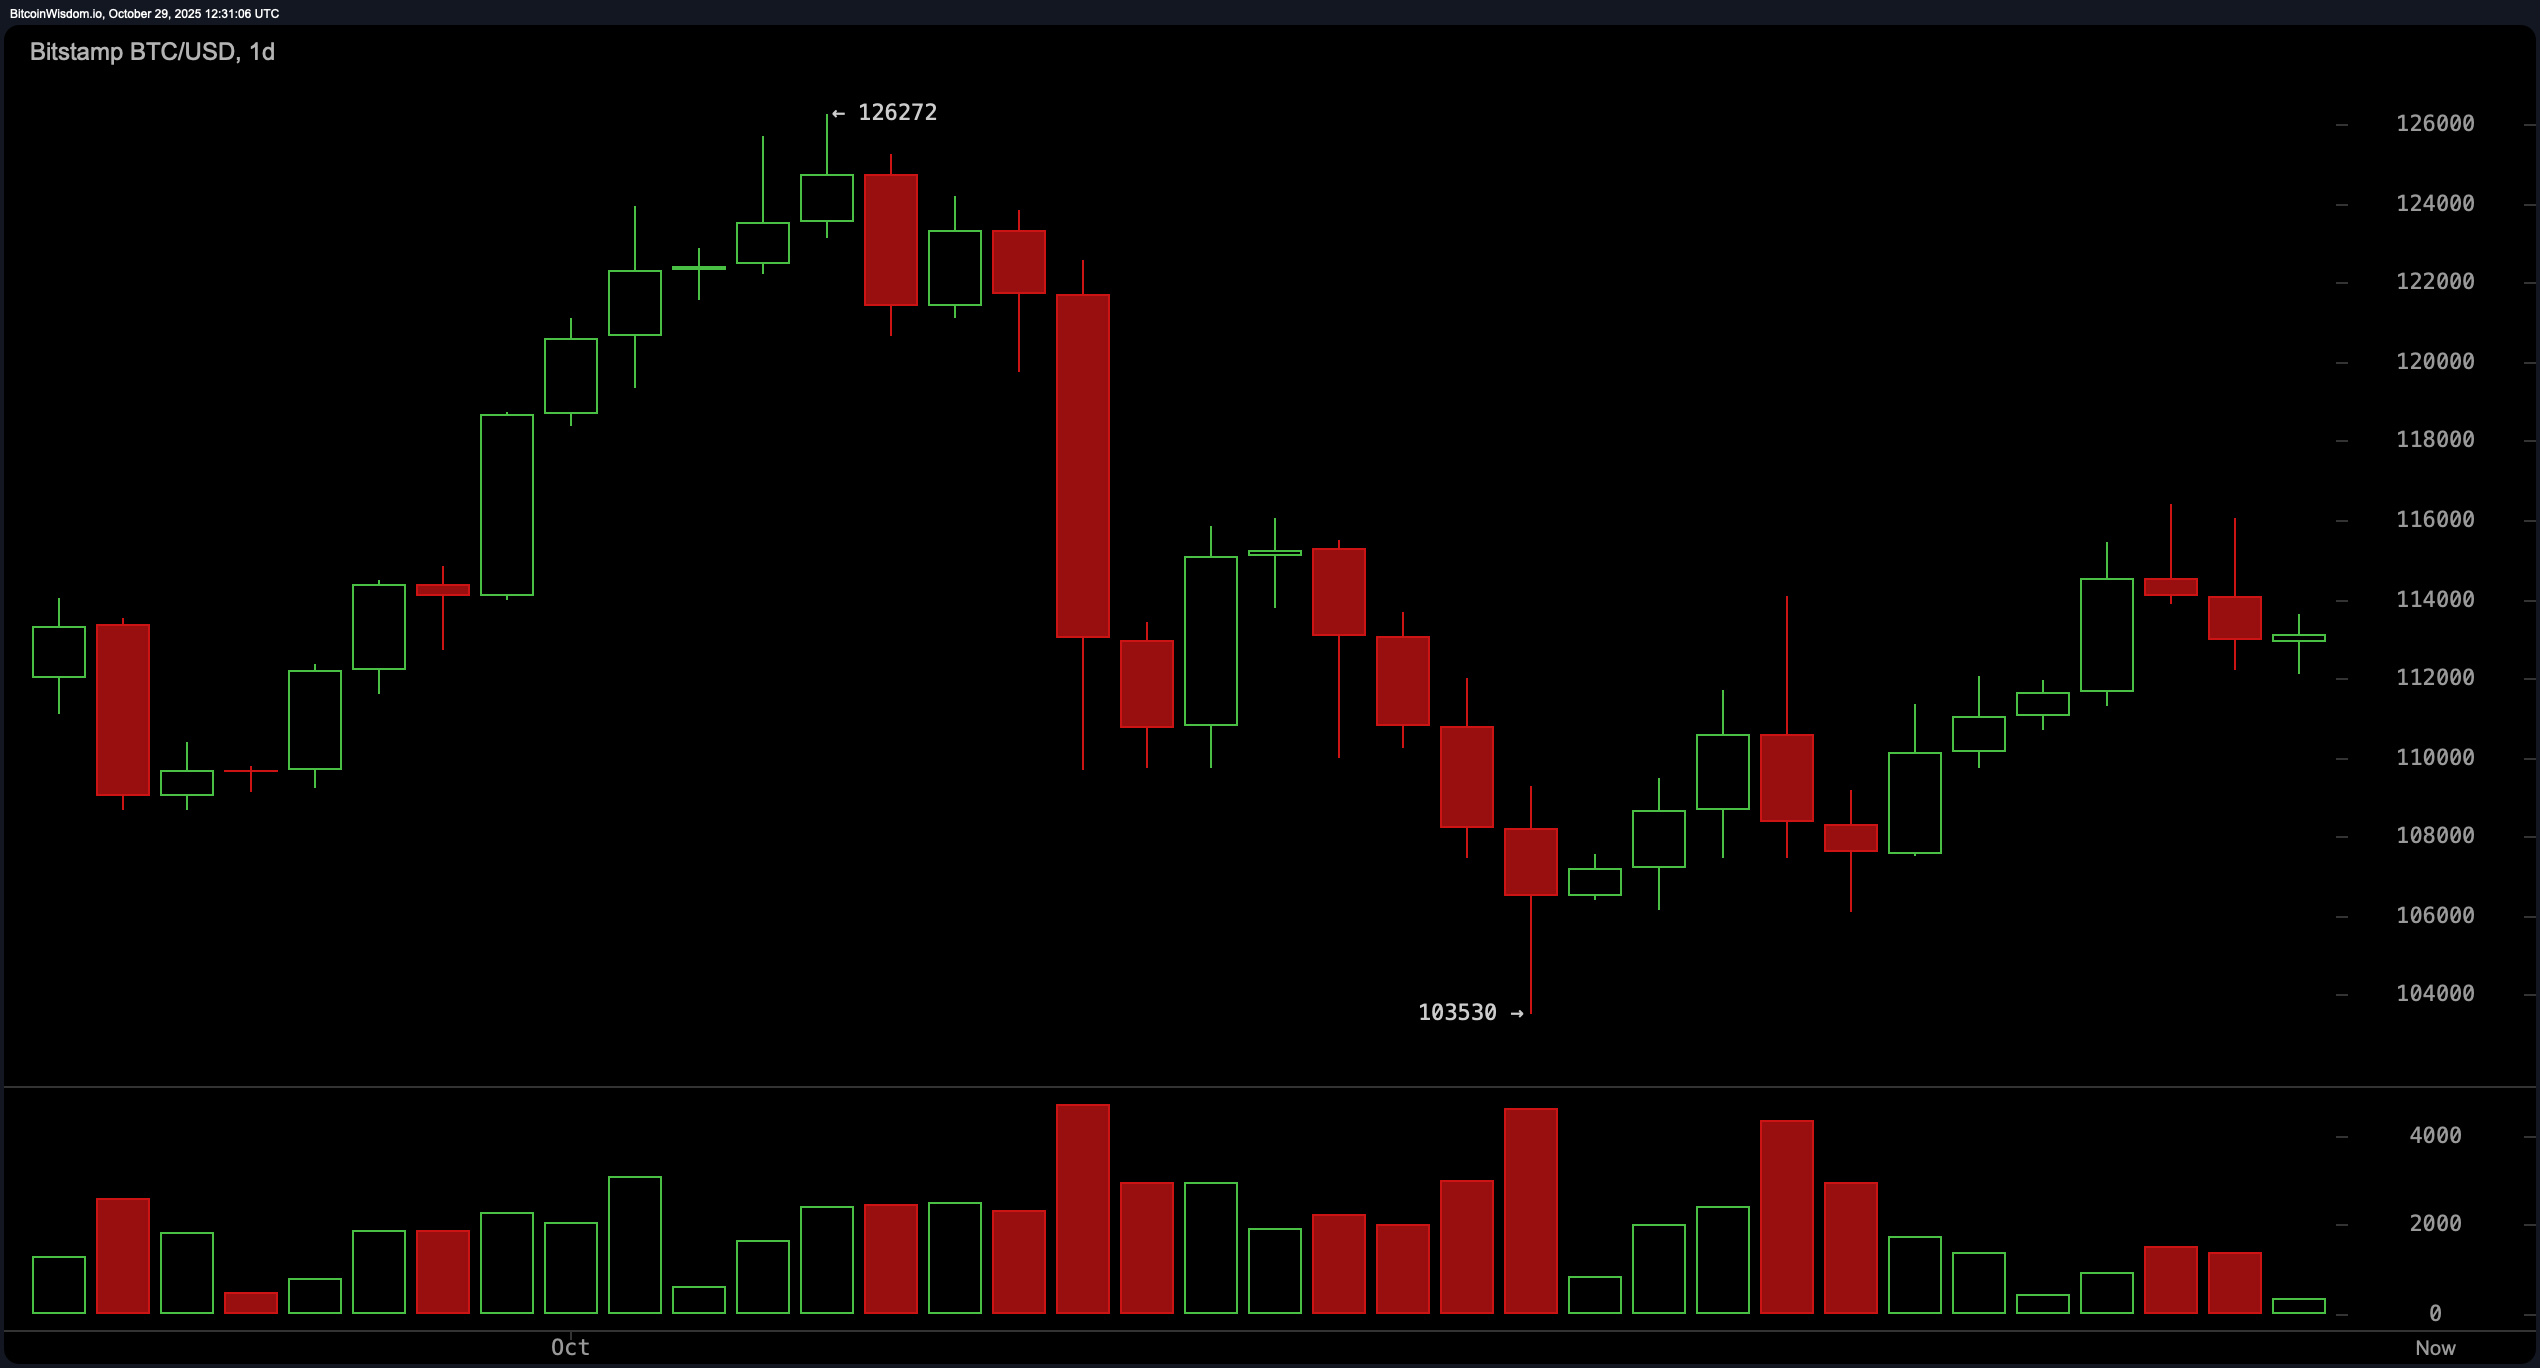
BTC/USD 1-day chart via Bitstamp on Oct. 29, 2025.
Zooming into the 4-hour chart, we find bitcoin caught in a mid-tier identity crisis. After failing to hold its ground at $116,381, it’s been dragging its heels around $113,000, surrounded by red candles and growing volume—translation: distribution is in the air. Bearish divergence is spreading faster than gossip in a trading floor. Until it reclaims $114,500 with conviction, the mid-term bias leans south. Break below $112,000? That’s an RSVP to the $110,000–$108,000 reunion.
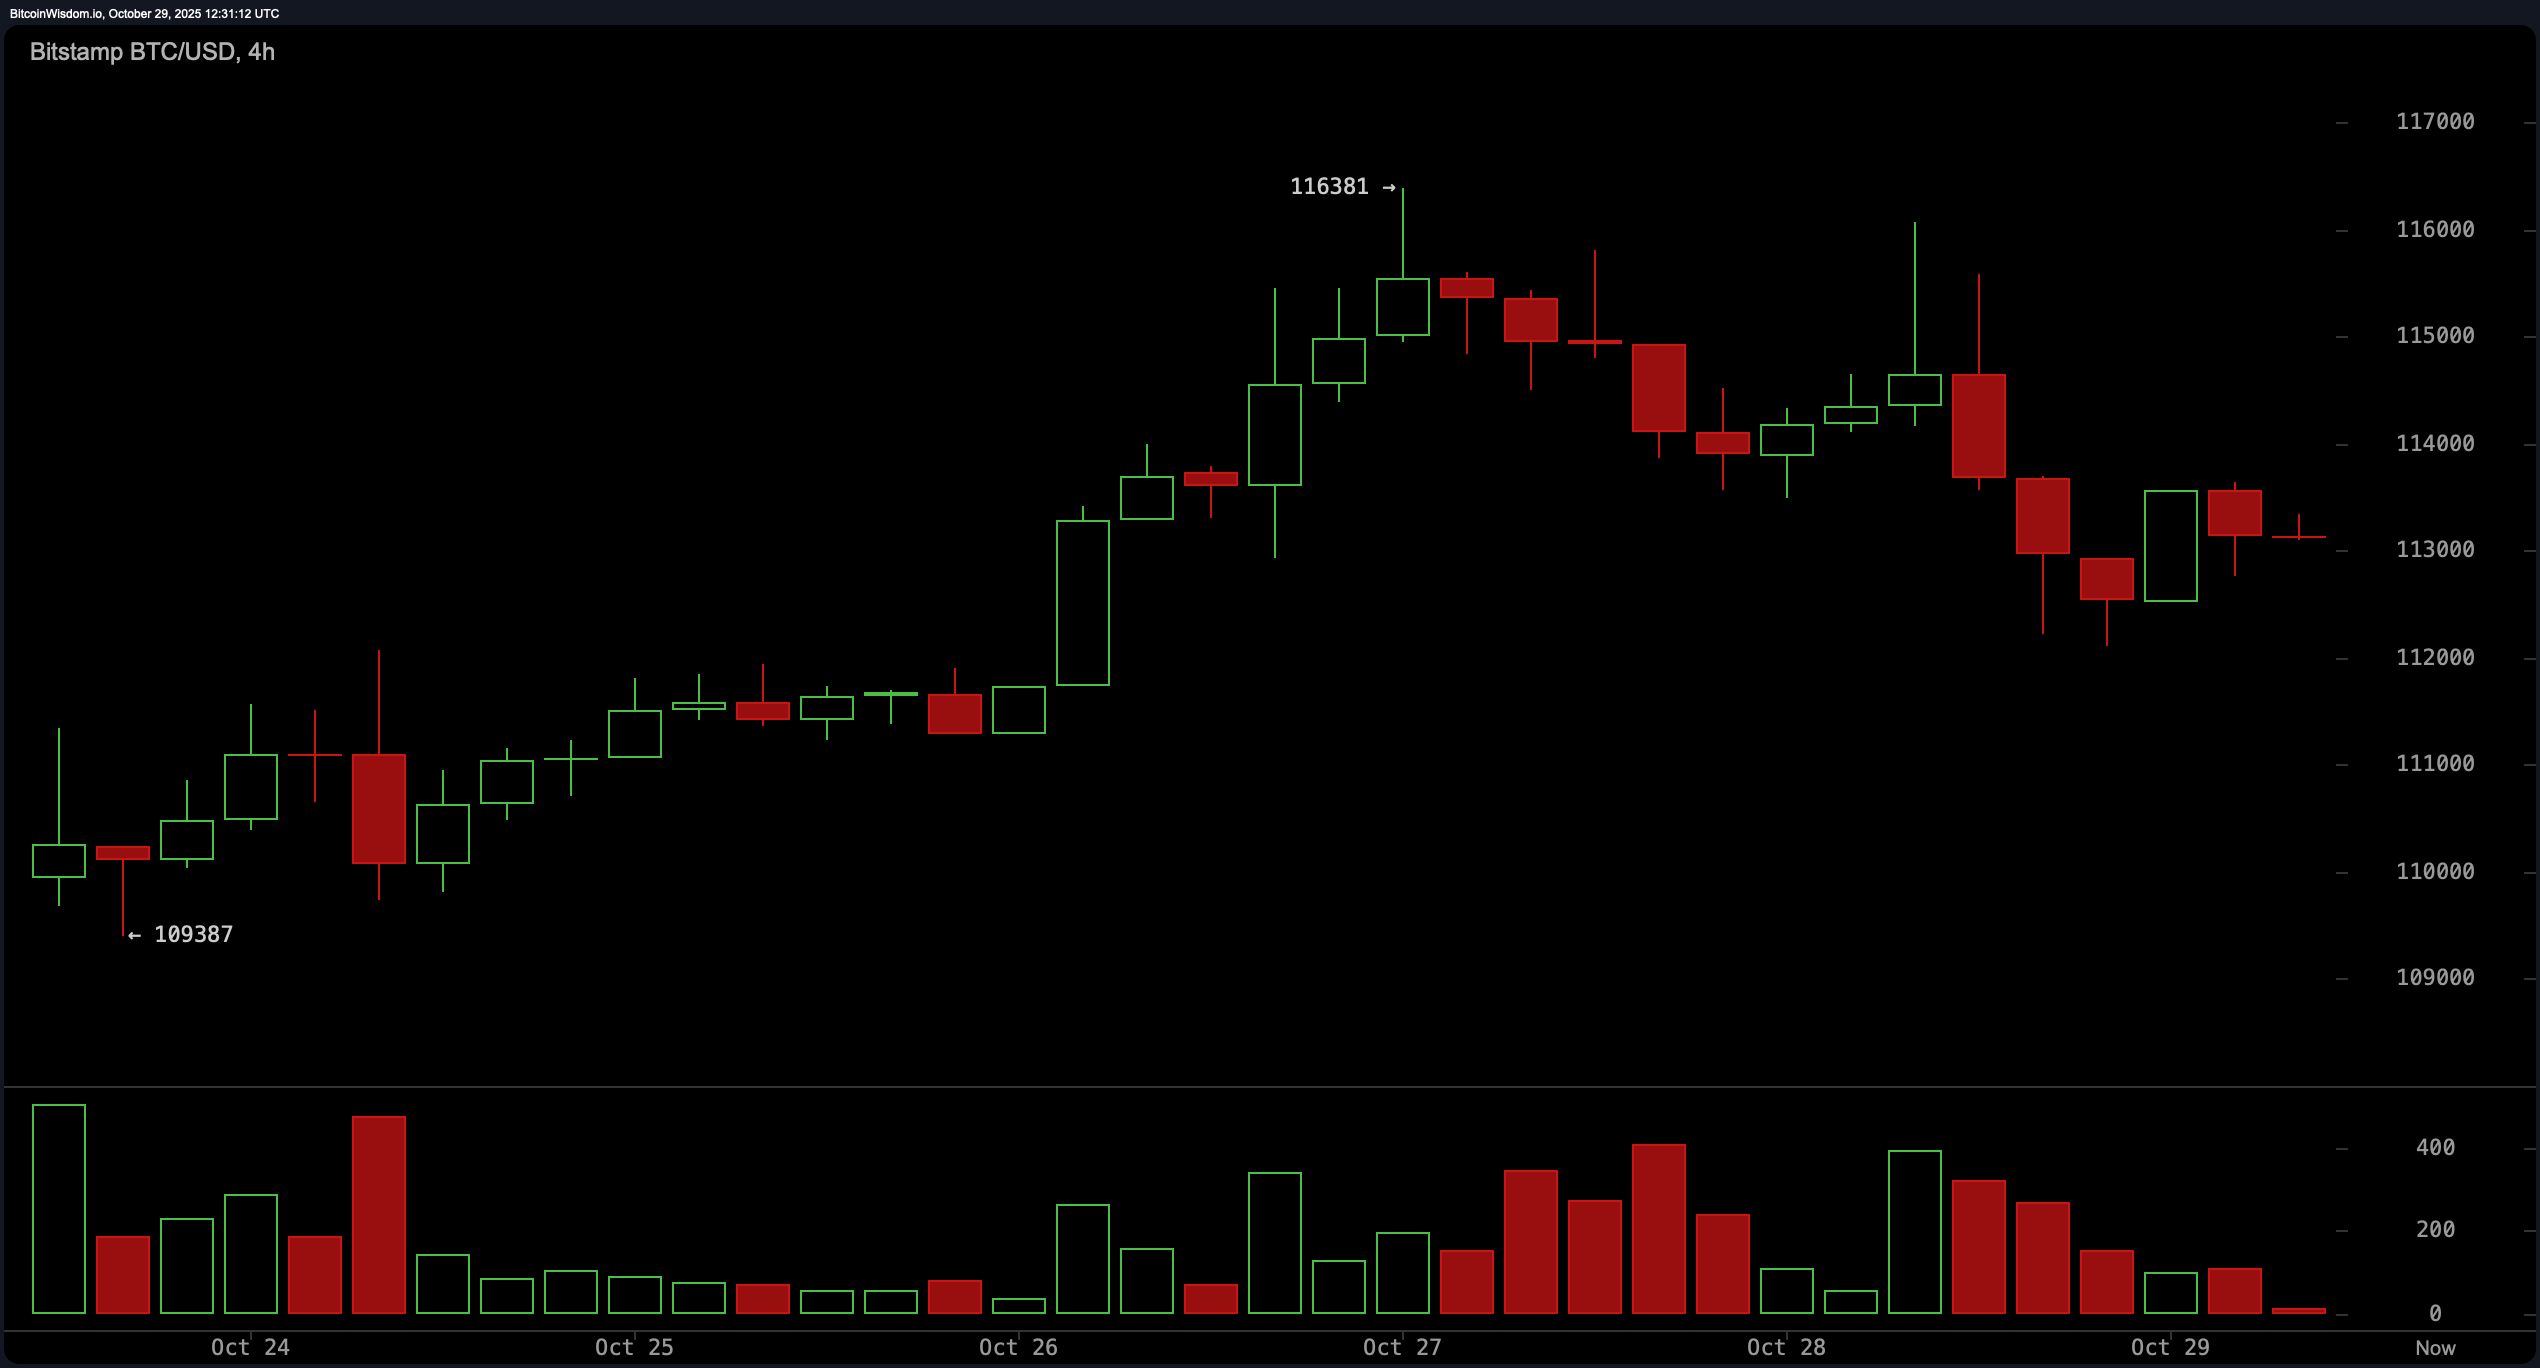
BTC/USD 4-hour chart via Bitstamp on Oct. 29, 2025.
On the 1-hour chart, bitcoin is performing the market equivalent of loitering. A sharp drop from $116,077 to $112,106 set the stage for what now looks like a low-volume game of “Will it, won’t it?” Traders are scalping within a tight band: $112,000 as the bouncer at the bottom and $114,000 as the velvet rope up top. A bounce from the lower range could offer a quick sprint to $114,000, while rejection there likely dumps it back to $112,500. The vibes? Uncommitted, but not boring.
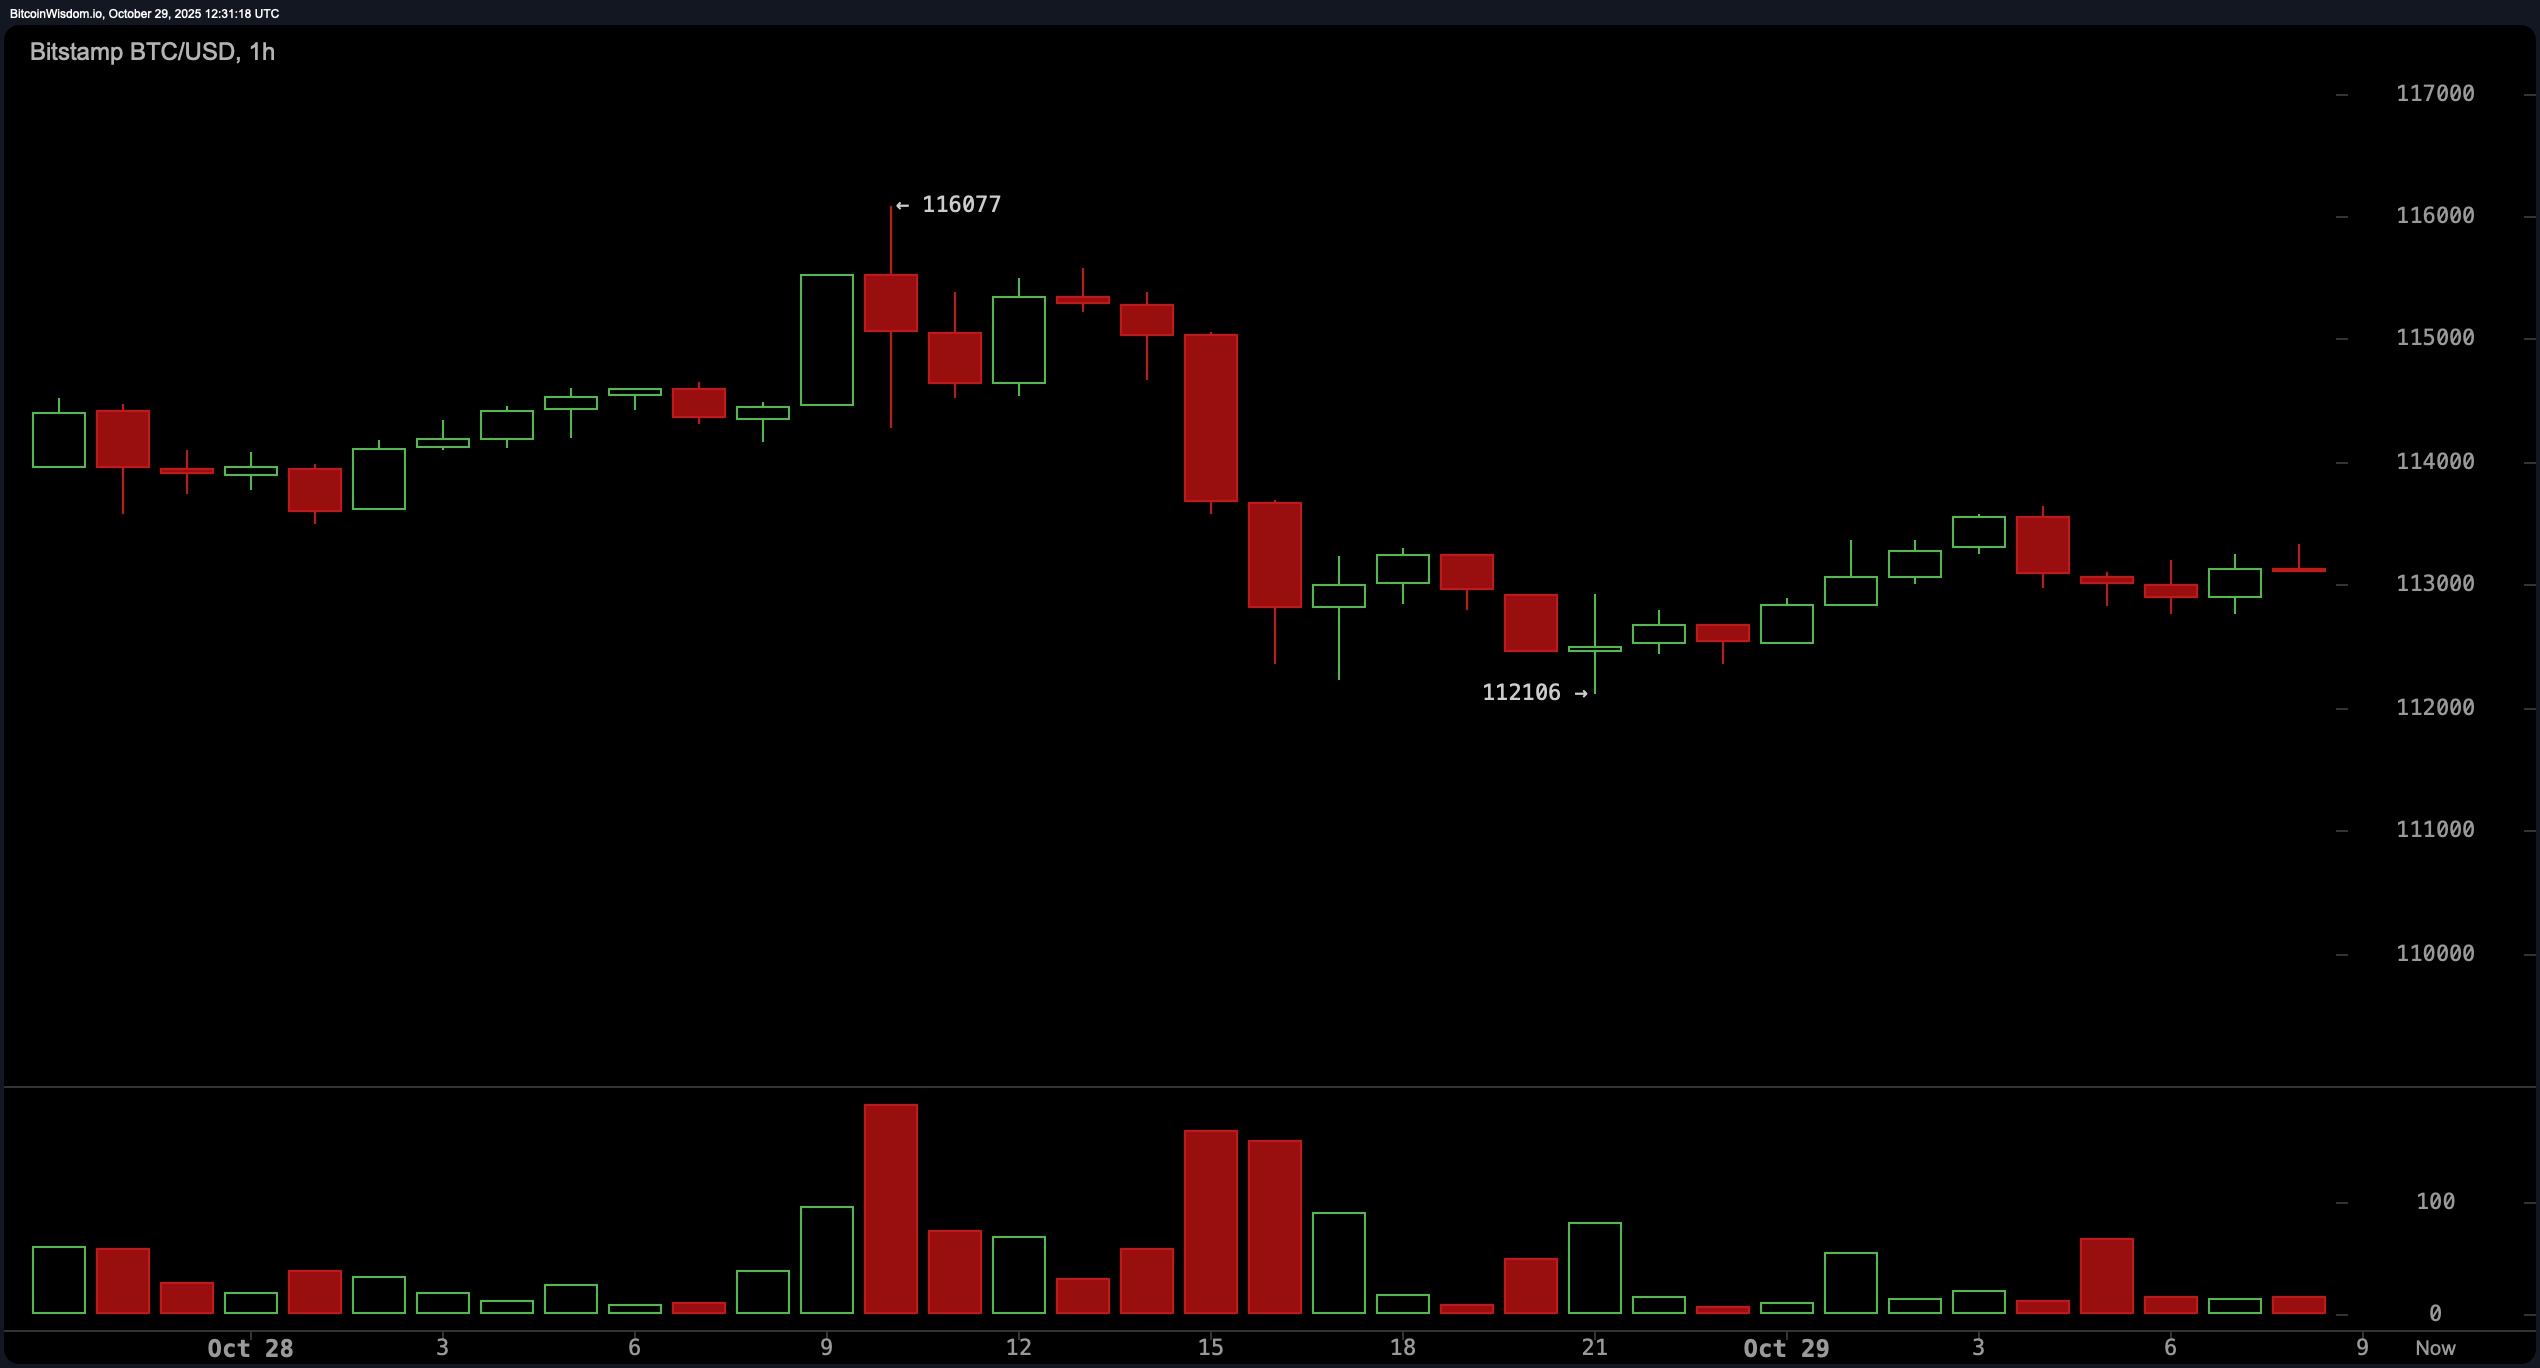
BTC/USD 1-hour chart via Bitstamp on Oct. 29, 2025.
Now let’s dish on the technical indicators. Oscillators are practically shrugging: the relative strength index (RSI), stochastic, commodity channel index (CCI), average directional index (ADX), and awesome oscillator are all in neutral territory. Momentum is the lone bear at the party, while the moving average convergence divergence (MACD) flashes a weak bullish lean. As for moving averages? Short-term exponential and simple moving averages (10 to 30) are supportive, but the longer spans (50 to 100) start to mix signals, with more sell flags popping up the further you zoom out. It’s like bitcoin’s got one foot on the gas and the other tapping the brake.
Multi-timeframe sentiment paints a story of contradiction. Macro conditions suggest a corrective rally at best, mid-term momentum says “not impressed,” and the short-term is just trying to make up its mind. Until bitcoin makes a decisive move above $114,500—or tumbles below $112,000—it’s stuck in a limbo of technical ambiguity. Traders should keep one eye on the charts and the other on the volume, because when it speaks, it often shouts.
Bull Verdict:
If bitcoin claws back above $114,500 with strong volume and holds that level as support, the bulls could regain control. This move would suggest renewed buying momentum and open the door for a retest of the $116,000–$117,000 resistance zone, with the potential to break higher if conviction follows.
Bear Verdict:
Should bitcoin lose the $112,000 support with heavy volume, expect gravity to do its job. A breakdown here would validate bearish momentum on both the 1-hour and 4-hour charts, exposing the path toward $110,000 and potentially revisiting the deeper support zone around $108,000.
FAQ💡
What is the current price of bitcoin? Bitcoin is trading at $113,171 as of October 29, 2025.
What is bitcoin’s market cap today? Bitcoin’s market capitalization stands at $2.25 trillion.
What is bitcoin’s trading range over the last 24 hours? Bitcoin moved between $112,249 and $116,041 in the past day.
Is bitcoin in an uptrend or downtrend right now? Bitcoin is currently range-bound with bearish pressure on higher timeframes.