On the evening of September 25, crypto analyst Kevin from Kev Capital TA shared insights with his audience, suggesting that Bitcoin’s recent dip follows a predictable seasonal and structural pattern. He emphasized that the market’s next significant move depends on maintaining a specific support range. “Hold between $107k and $98K,” he advised, describing this zone as crucial for the continuation of the bull cycle.
As Bitcoin’s price fell to $108,651 amidst growing bearish sentiment, Kevin reassured traders that this decline should not be unexpected for those who are disciplined. He contextualized this movement within months of caution dating back to early August when he began noting weekly bearish divergences in Bitcoin, Ethereum, and the broader altcoin market (Total2), highlighting resistance zones established over more than four years.
“Many believe these symmetrical triangle patterns after an upward move indicate continuation,” he explained. “However, in crypto markets, it’s rare for these patterns to break upwards.” He noted a series of smaller impulse highs since late 2023 and reiterated that despite sharp rallies in some altcoins, major cryptocurrencies have not surpassed any significant resistance levels.
Bitcoin Top In Until Proven Otherwise
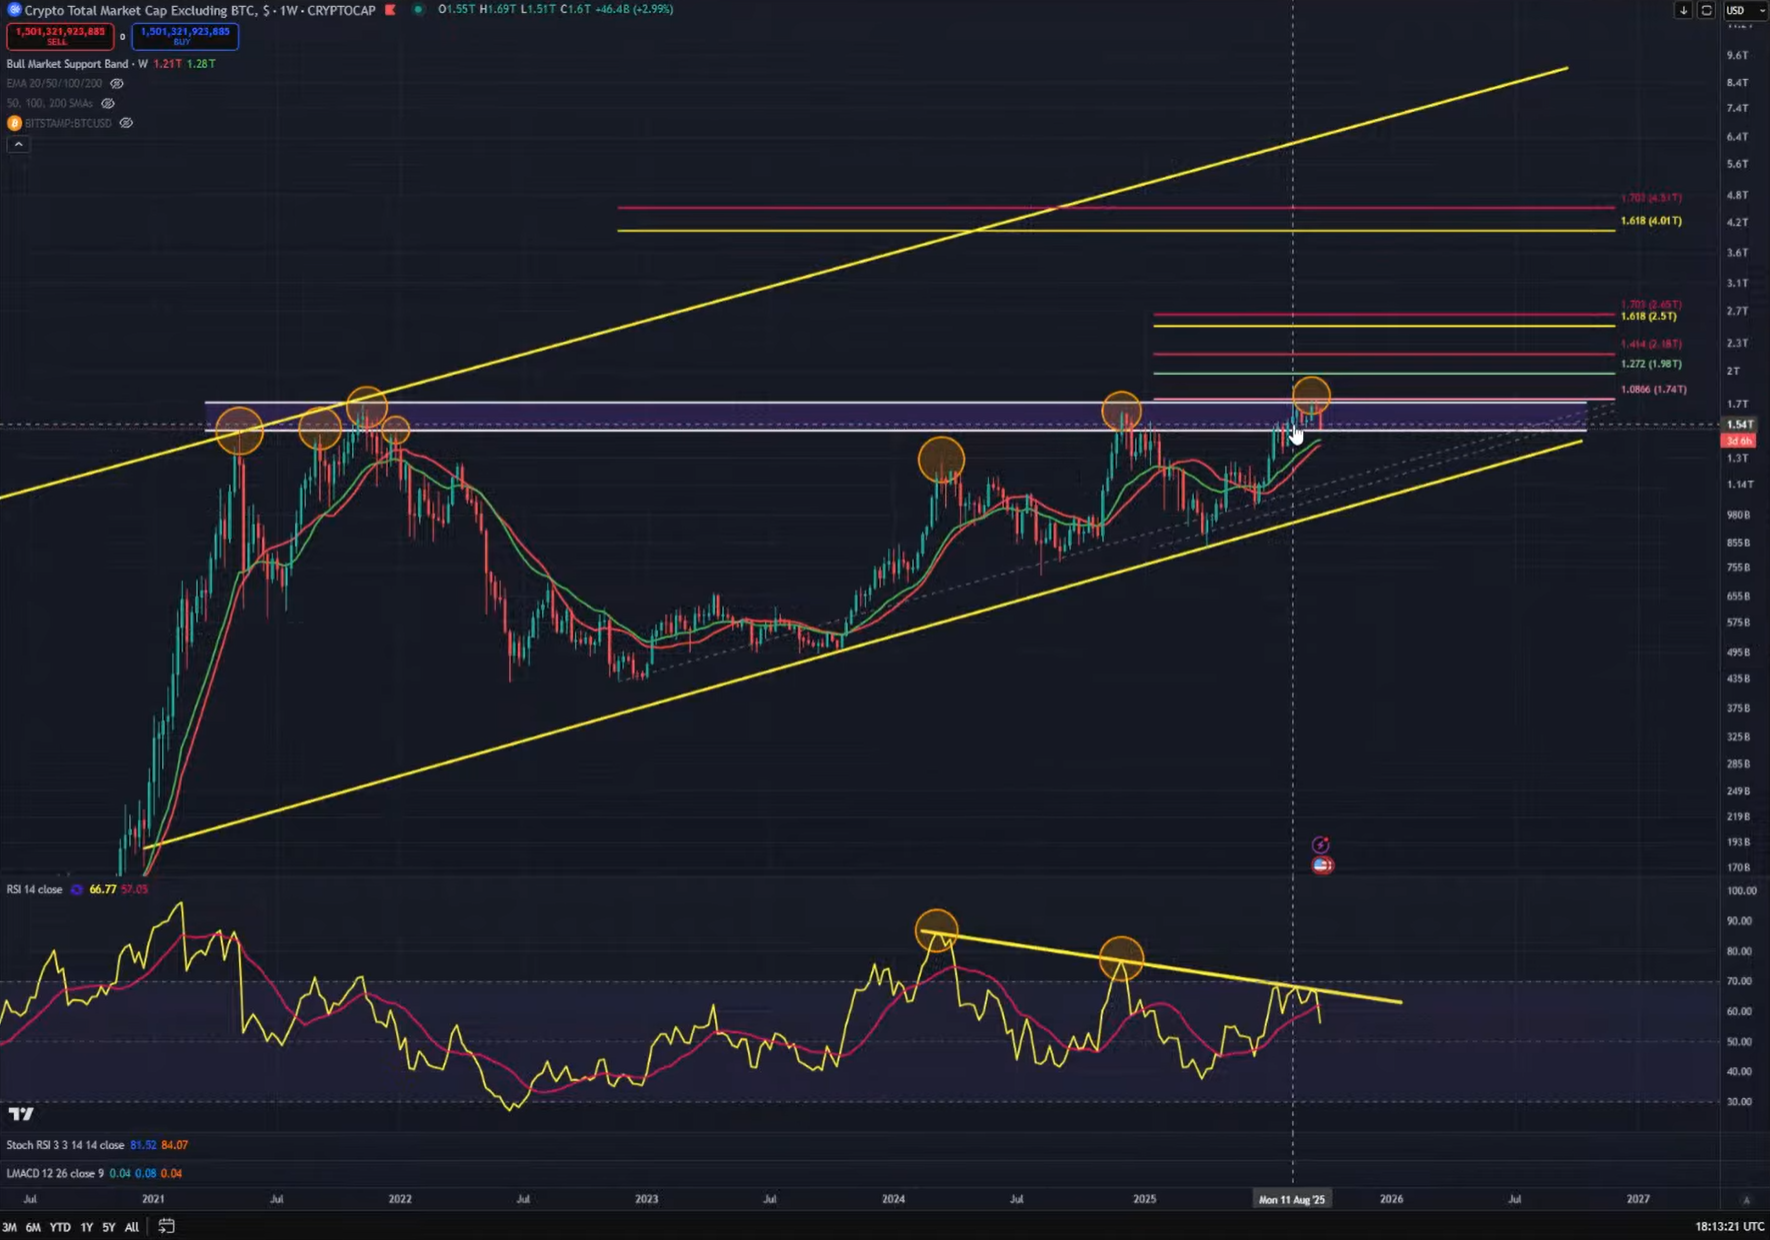
The foundation of Kevin’s analysis is based on confluence across higher time frames. On Bitcoin’s weekly chart, he identified rising price highs against declining momentum—simple strength and momentum indicators—not signals by themselves but context indicating long-term weakening.
Total2 also showed “a triple top on the weekly” just below approximately $1.71–$1.74 trillion—considered an ultimate resistance level—with both RSI and MACD showing downward trends. According to him, momentum stocks are resetting exactly where expected amid historically low liquidity during late summer months. “Q3 is never favorable for crypto,” Kevin remarked about August and September being consistently poor months historically.
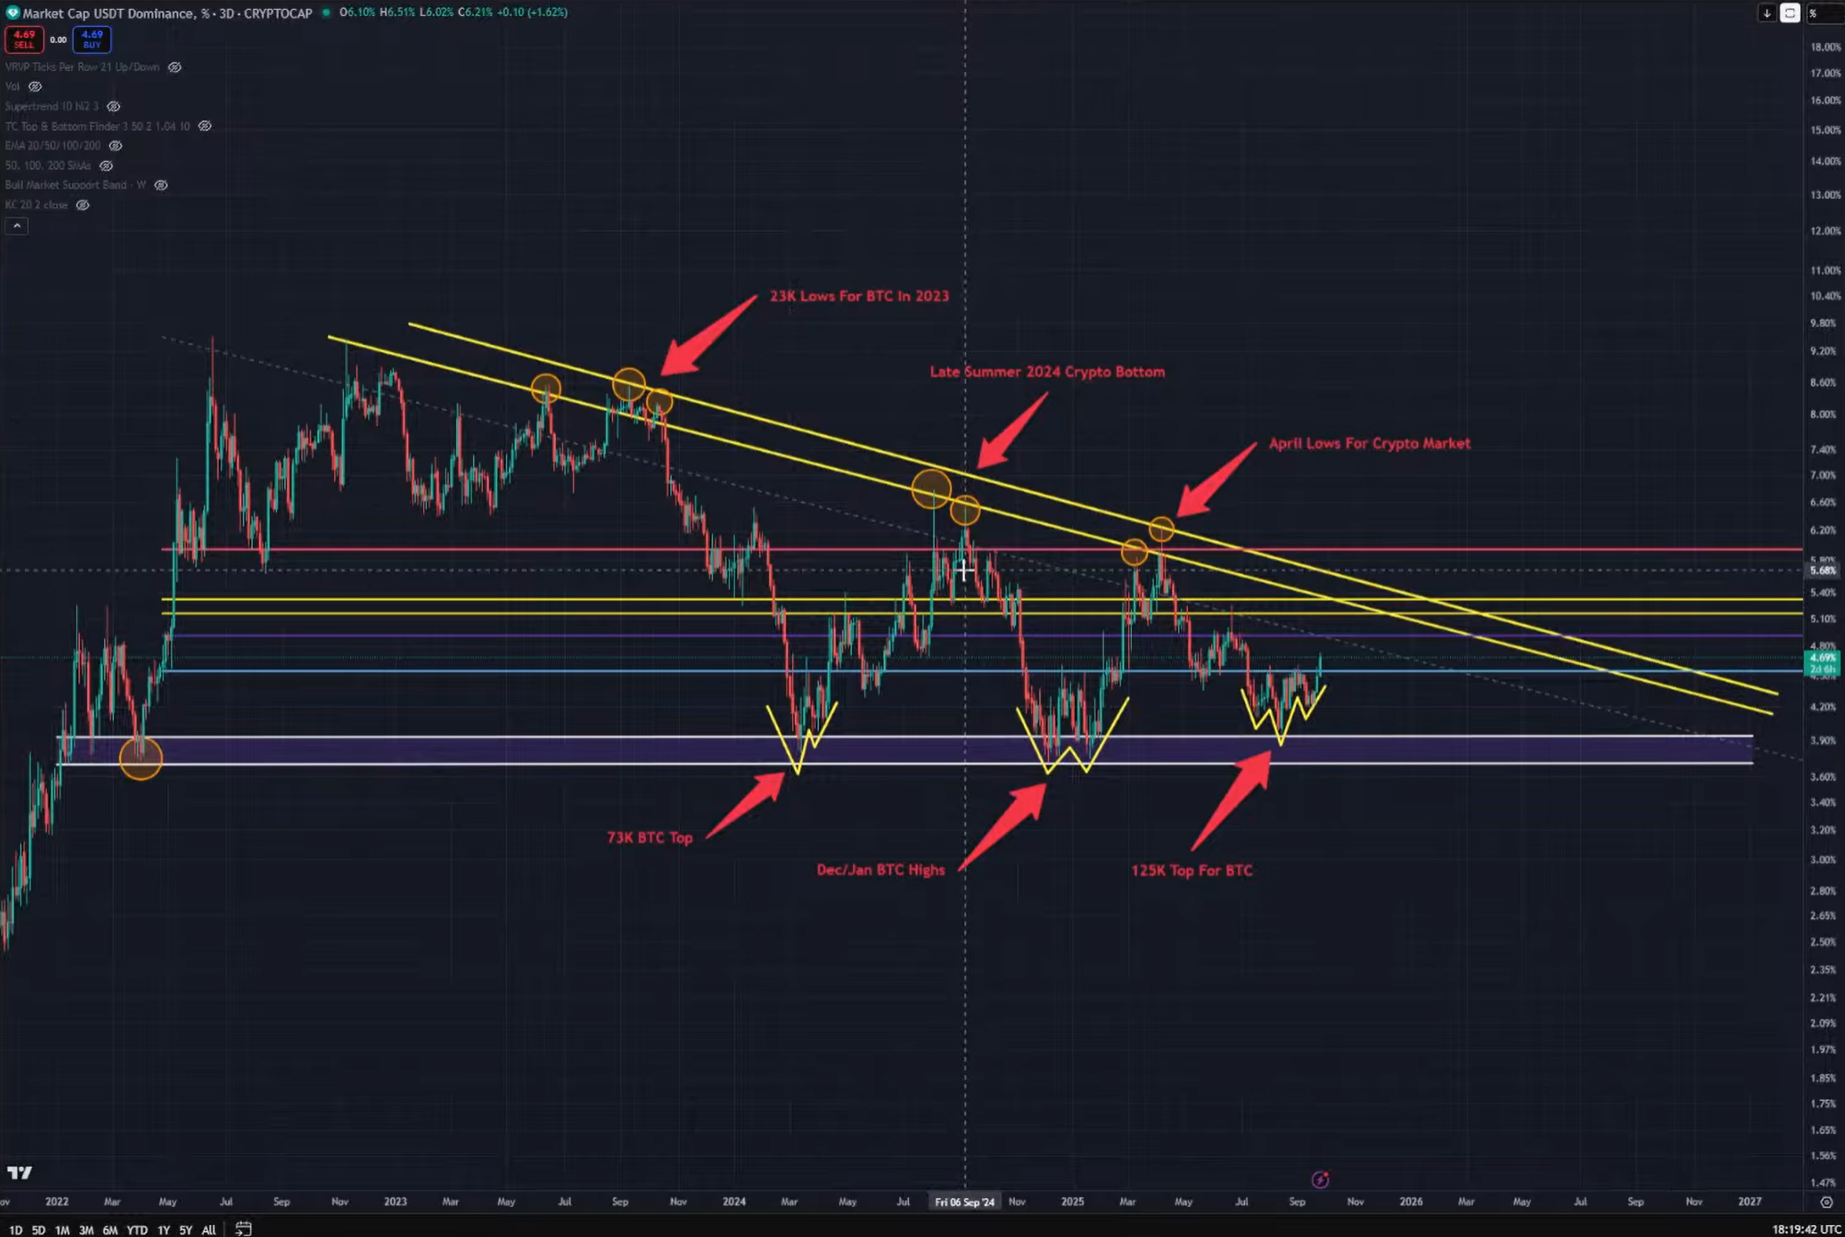
In this context furthering his argument was USDT dominance acting as an inter-market compass; “USDT dominance remains unparalleled,” according to him while discussing macro descending triangles featuring flat-bottom supports near 3.9–3.7% alongside repeated rallies towards falling trendlines mapping out cyclical lows/highs over two years now.
Each approach towards flat bottoms carved W- or inverse-head-and-shoulders-style bases within USDT.D while BTC distributed around local tops whereas rejections at downtrends coincided with inflections across cryptos .”You don’t need any other charts besides BTC &;USDT dominance,” said confidently adding how playing cycles perfectly relied solely upon them alone !
From tactical perspectives highlighted were three-month-long liquidity heat map shelves located close-by around $&;#&106;.8K alongside EMA bands supporting bulls positioned nearby at approximately #&109;.2K naturally attracting attention whilst lower Bollinger Bands resided roughly about one hundred one thousand dollars respectively .
Emphasizing importance regarding avoiding losses beneath aforementioned thresholds ensuring intactness throughout cycles though temporary wicks swiping liquidities consistent prior resets nonetheless framing ninety-eight thousand dollar lines unbreakable decisively given abundant supports existing ranges ; expressed shock if unable bouncing somewhere therein eventually .
All Eyes On Q4 Seasonality
Kevin linked structural signals explicitly aligning macro checklists arguing lasting cycle tops/bottoms correlate fundamentally rather than relying solely upon chart readings alone citing past events like inflation spikes initiating Fed hikes causing drawdowns exceeding fifty-five percent circa twenty-twenty-one followed by CME futures launches triggering blow-off tops previously seen during twenty-seventeen then finally FTX collapses capitulating amidst bullish divergences observed last year.
“Always exists macro-related reasons correlating charts” said contrastingly observing absence current end-cycle triggers today pointing choppy yet contained inflation gauges coupled expectations easing into year-end provided labor softens seasonal favorability towards fourth quarters underscored calendar significance upcoming October data releases determining risk appetites ahead specifically core PCE CPI labor statistics shaping directions mid-month onwards predicting potential upswings contingent positive outcomes potentially including rate cuts subsequently entering Q4 periods.
Volatility positioning suggested sharp directional moves post-reset completion wherein record-low Bollinger Band Width readings occurred thrice already throughout previous quarters each starting downside breaks ranging eighteen-to-twenty-nine percent before surging fresh highs thereafter massive movements anticipated soon spot volumes declined since November meanwhile tightening bands reaching historic extremes testing lower band possibilities albeit unnecessary broader corridor functioning springboards key factors moving forward.
Explicit invalidation upside triggers labeled major tops temporarily requiring confirmations via monthly closures surpassing specified levels ensuring continued trends otherwise rotations likely shifting back alternative coins once bases form accompanied printing lower high scenarios emphasizing patience management profit-taking resistances bottom-line combining restraint opportunism repeating hold strategy navigating initial weeks awaiting decisive economic reports ultimately finding lows leveraging favorable conditions eventually progressing higher warned benign macros deteriorations necessitating reassessment thesis until then message remained unapologetically straightforward respecting seasonality tracking inter-market cues letting longer-term frameworks dictate actions reminding best validation lies correctness rather mere clickbait seeking purposes exclusively .
BTC traded currently priced around one hundred nine thousand six hundred seven dollars at press time featured image created using DALL.E charts sourced TradingView.com