The current downturn in the cryptocurrency market may escalate in the short term as Bitcoin exhibits at least three concerning patterns on its weekly chart.
Overview
Bitcoin has developed a rising wedge pattern on its weekly chart, signaling potential bearish movements. Furthermore, a bearish divergence pattern has emerged, indicating a possible crash that could trigger a more severe decline across the crypto market.
Concerning Patterns in Bitcoin Price Chart
The weekly chart for Bitcoin (BTC) reveals the formation of highly pessimistic chart patterns.
To begin with, there is evidence of a bearish divergence pattern. The Relative Strength Index has been following a downward trend channel since January of last year, indicative of this bearish divergence.
In addition, the Moving Average Convergence Divergence (MACD) indicator has been steadily declining since December last year. The crossover between its two lines suggests further downside potential. Notably, histogram bars have consistently remained below the neutral point this month.
The Awesome Oscillator also shows continuous decline since December. Collectively, these indicators – RSI, MACD and AO – point towards an established bearish divergence pattern for Bitcoin’s price action which often precedes an extended period of downward movement.
You might also like: Ethereum price dips below $4,200 as crypto market sentiment turns bearish
Further exacerbating concerns is BTC’s formation of a rising wedge pattern since July last year. The lower boundary connects previous low points from July last year to April and August this year; while the upper boundary links high points from December to July and August respectively.
The convergence levels approaching for these two lines suggest an imminent strong breakdown towards further downside momentum. In such scenario, Bitcoin could breach key support levels including $100,000 psychological mark and target $74,720 – its lowest level seen in April this year.
A significant crash in Bitcoin’s price would have broad negative implications for other cryptocurrencies given its influence on overall market sentiment and performance across altcoins.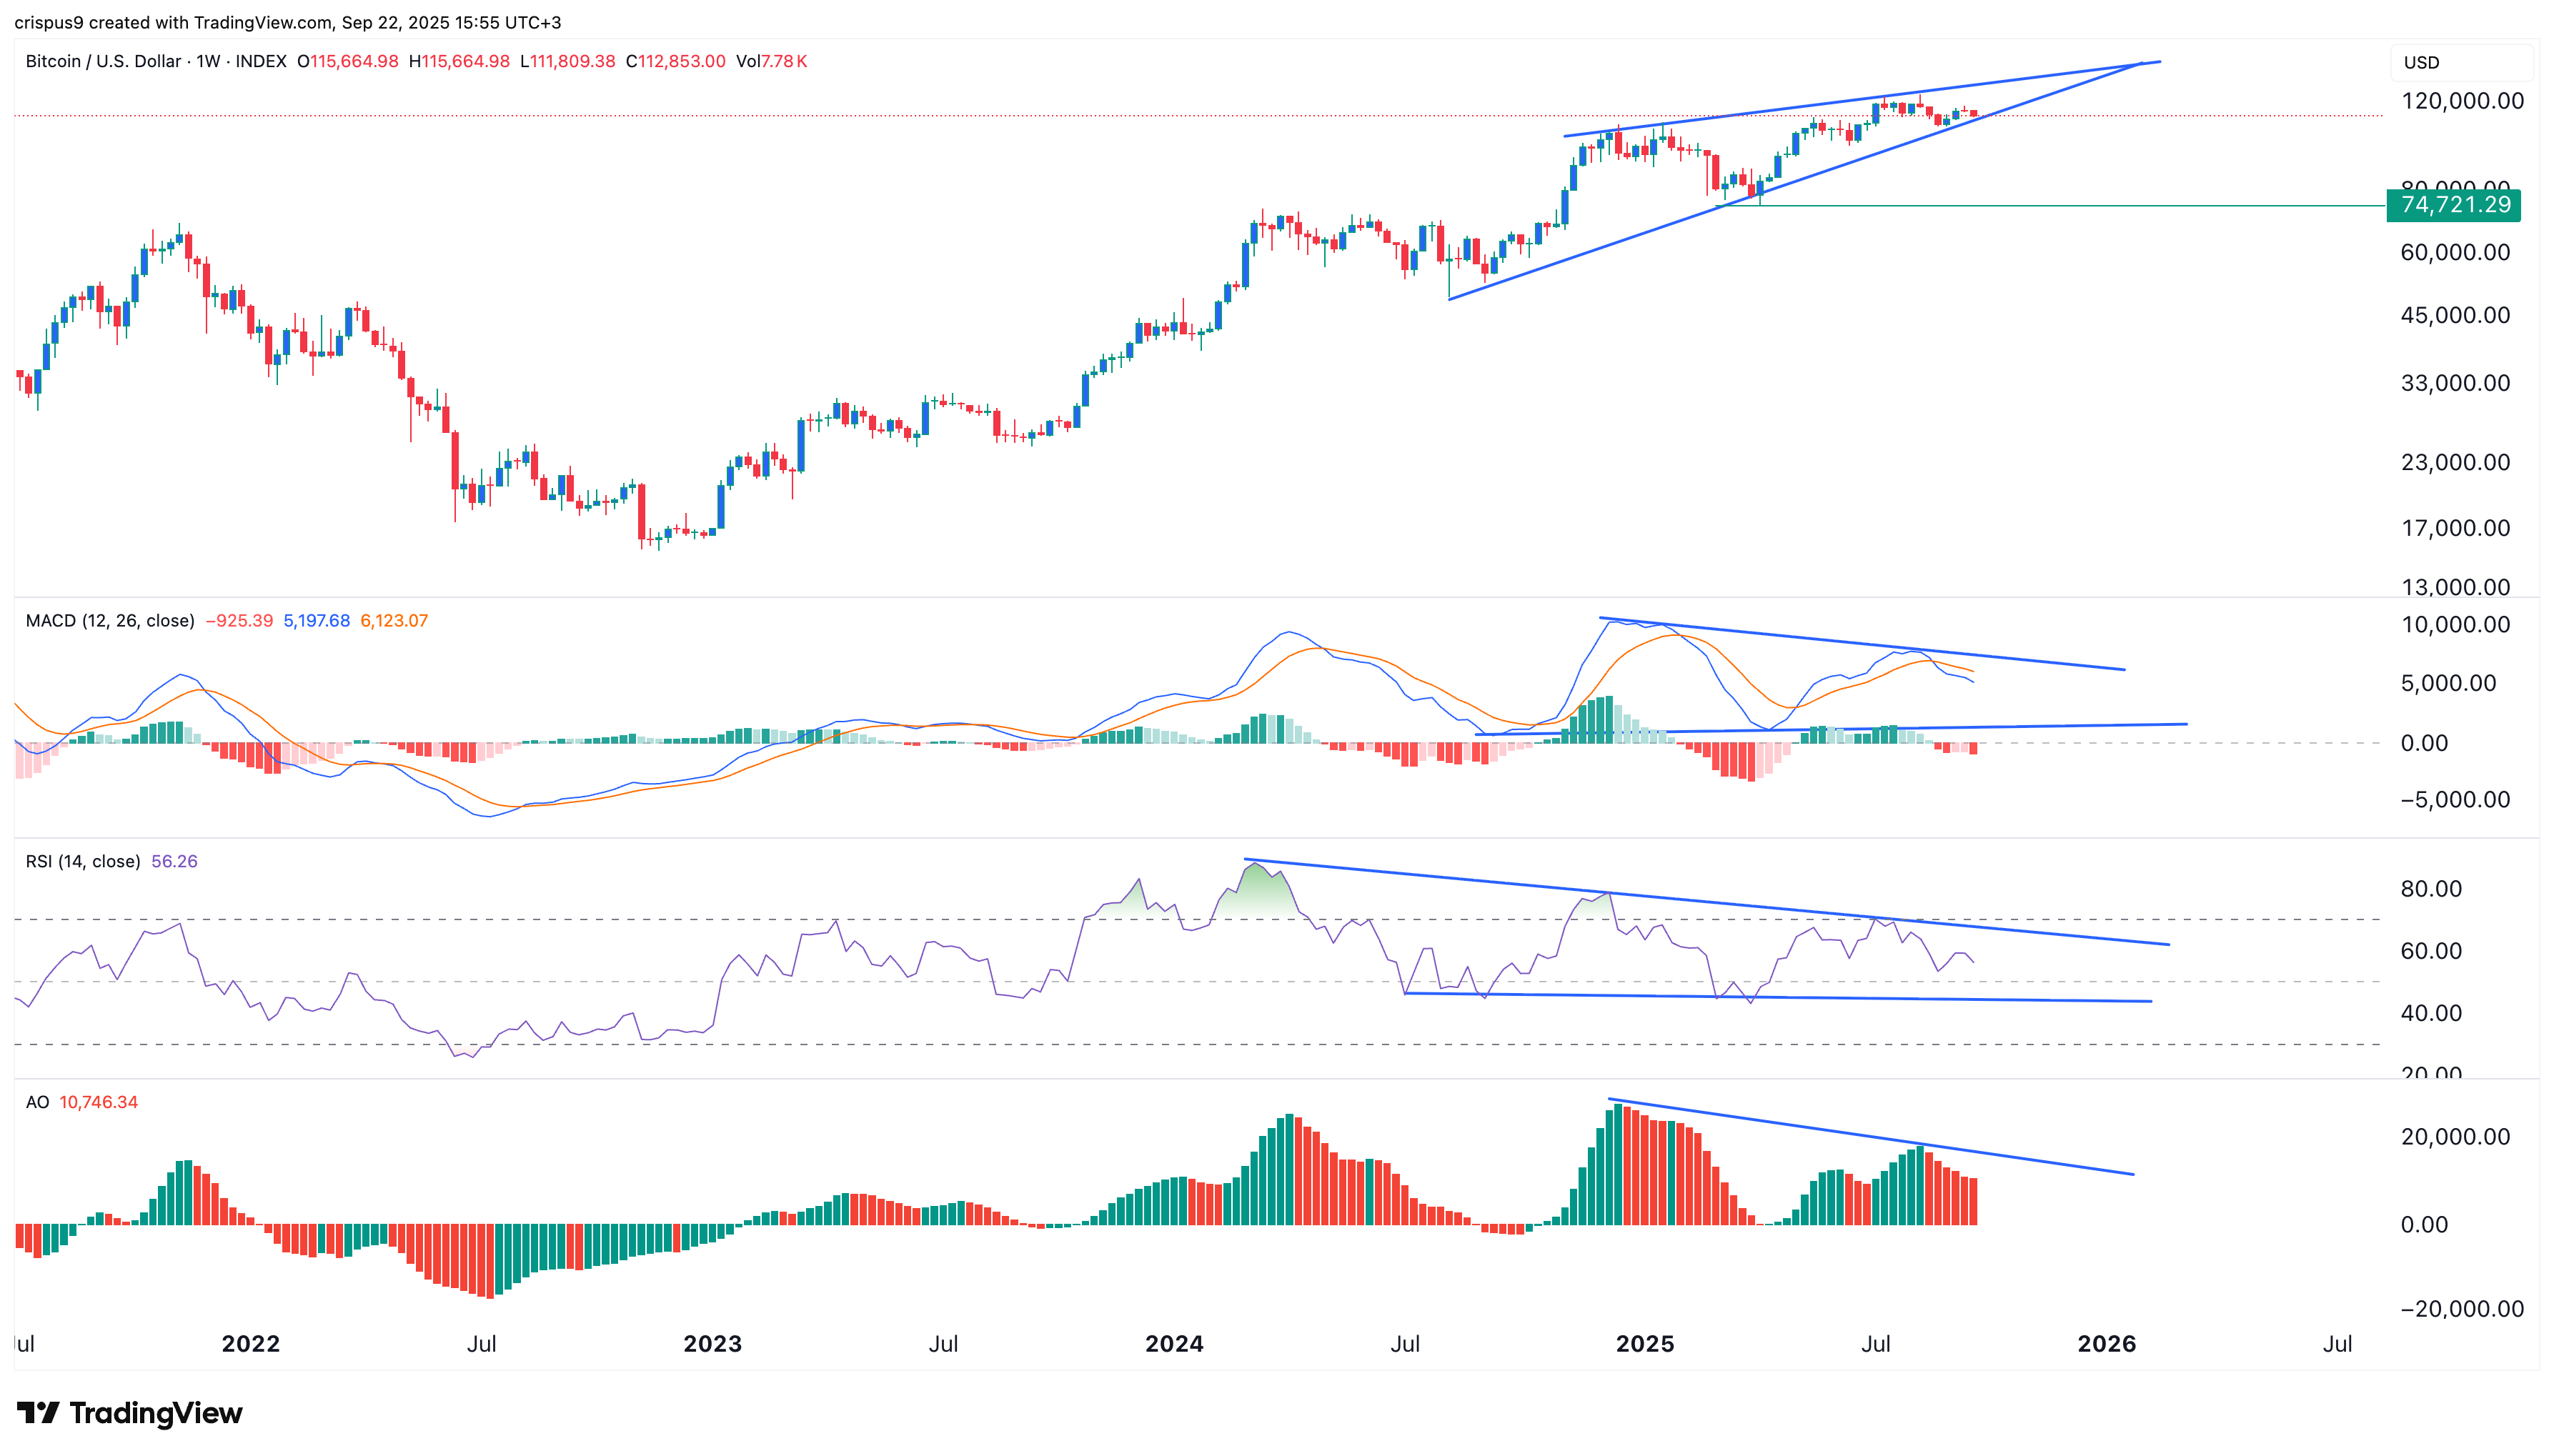
Bullish Catalysts Amidst Crypto Market Challenges
You might also like:‘Uptober’ rally in trouble? Why crypto prices are turning red
-
Still,
-
the
-
crypto
-
market
•
The Federal Reserve recently initiated interest rate cuts with expectations pointing towards further reductions.•
Historical data indicates that Q4 typically sees positive performance within the crypto space.•
Anticipated approval by SEC for altcoin ETFs along with robust investor demand signals positive outlook.•
ETFs such as DOJE and XRPR have already garnered substantial assets indicating growing interest among investors.
Act 33 ETFs are expected to attract increased inflows due to their competitive expense ratios backed by reputable sponsors like Franklin Templeton and Invesco.
Therefore,
despite prevailing challenges,
there remain optimistic factors driving growth within
the cryptocurrency sector over coming months.