
The rates of most of the coins are falling at the beginning of the weekend, according to CoinStats.
BTC/USD
The price of Bitcoin (BTC) has declined by 1.89% over the last day.
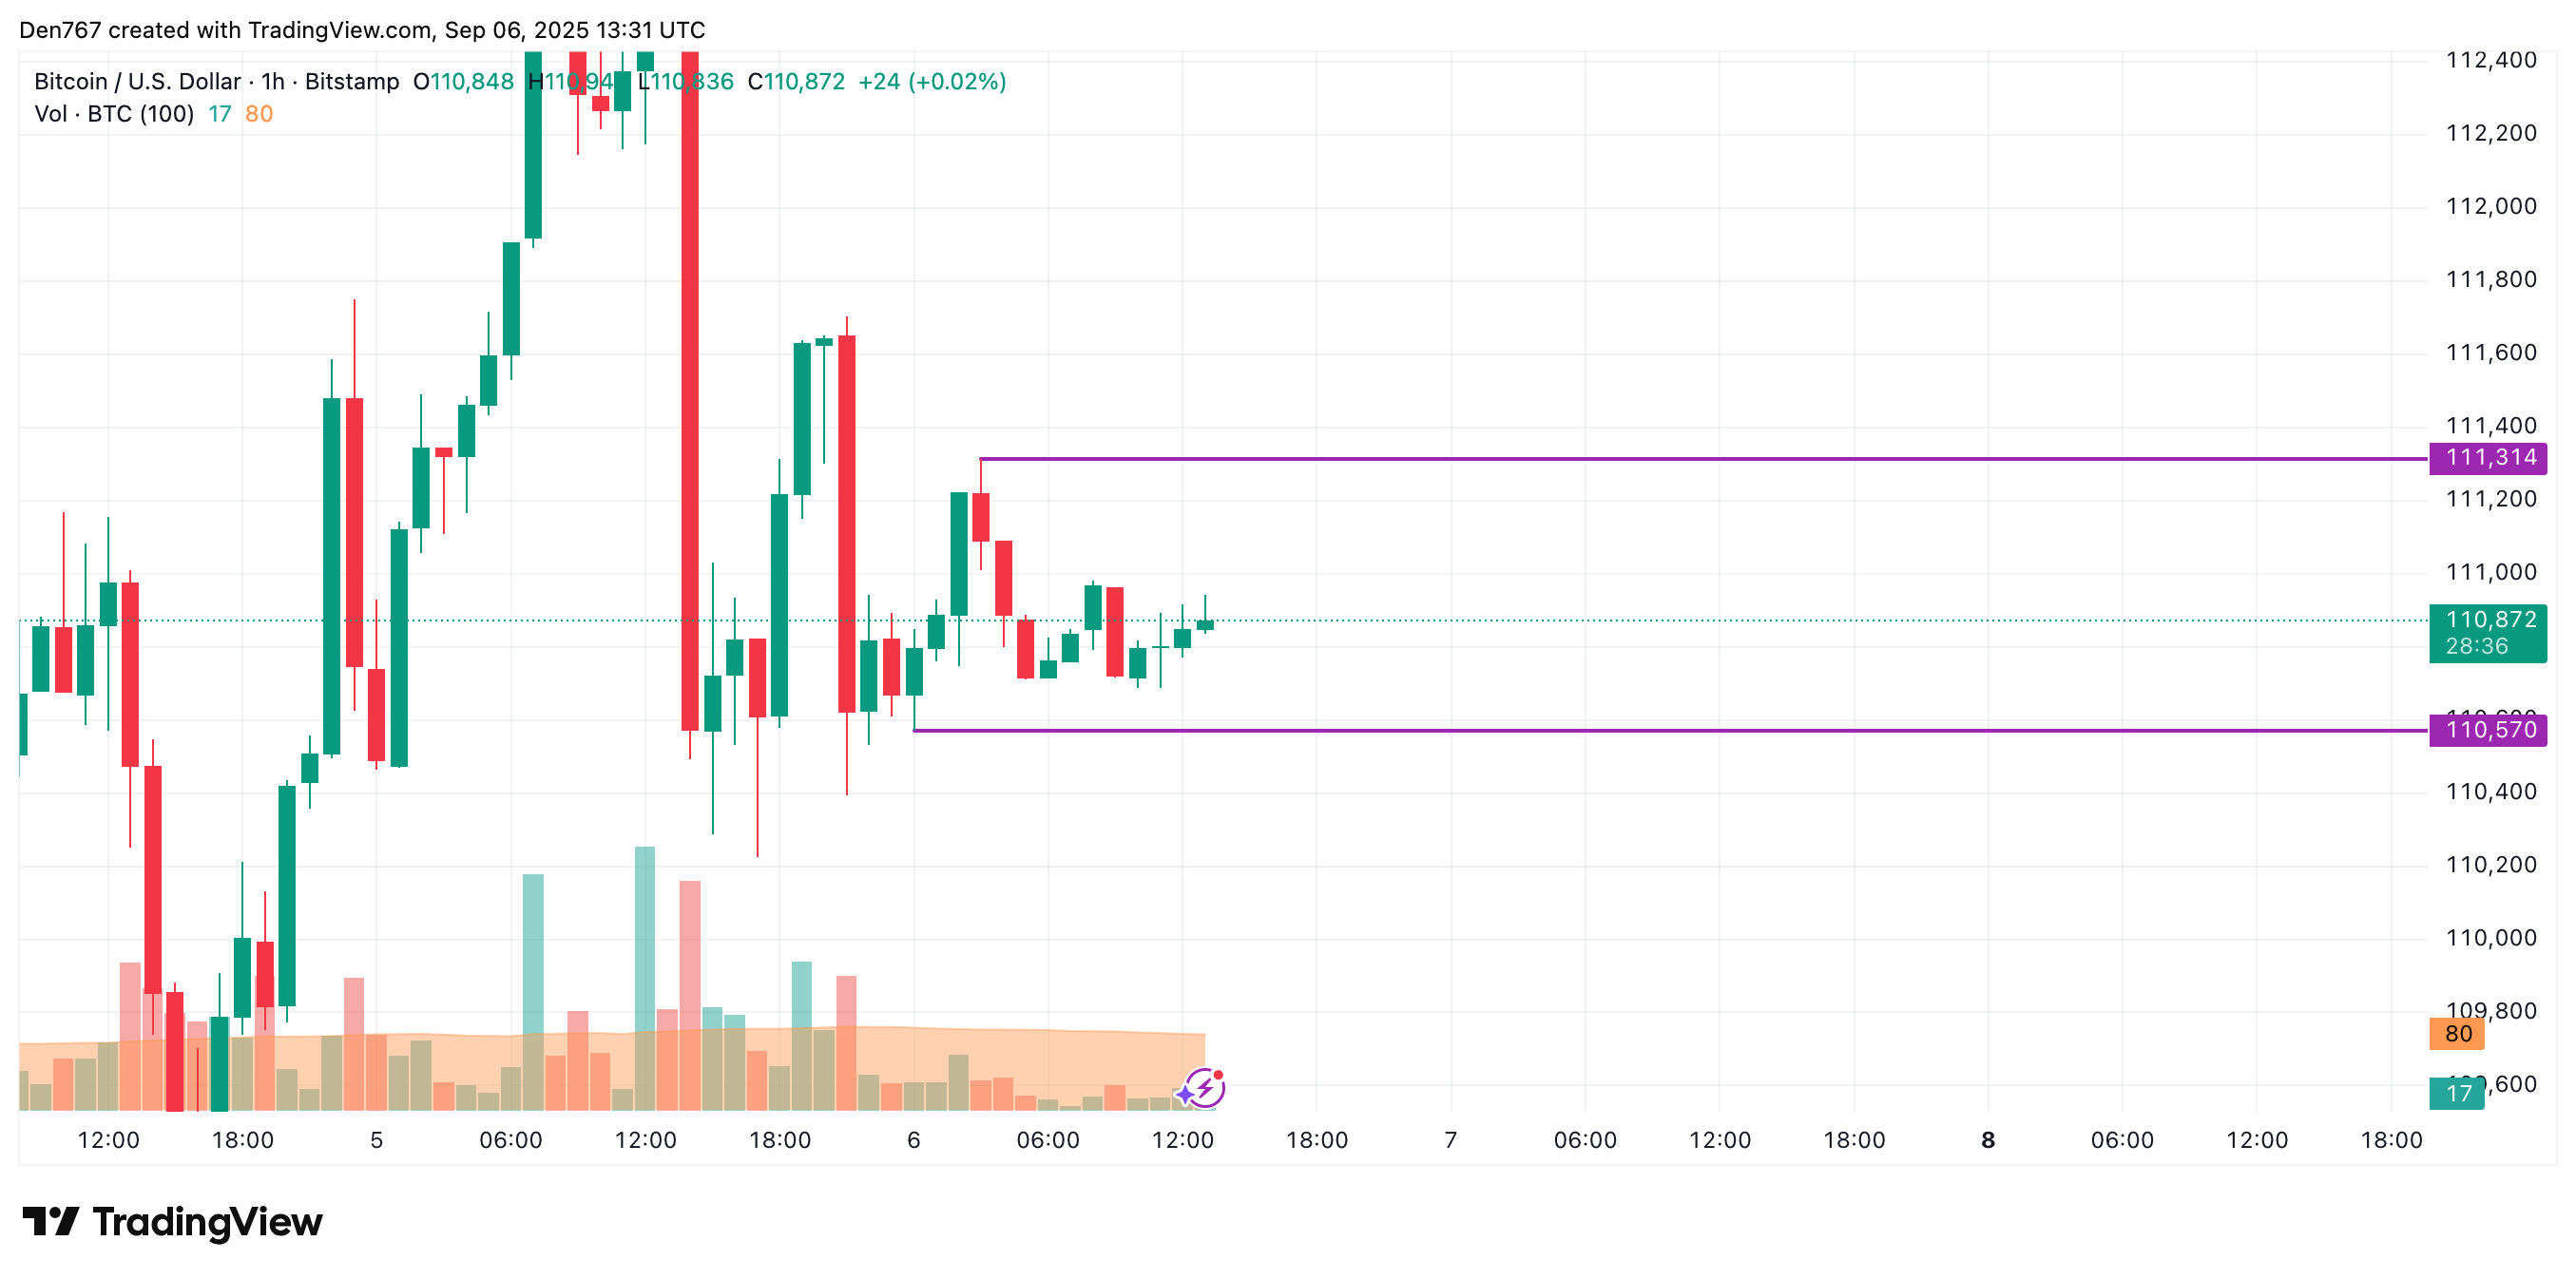
On the hourly chart, the rate of BTC is more bearish than bullish as it is closer to the support than to the resistance level. If the situation does not change, one can expect a test of the $110,570 mark by tomorrow.
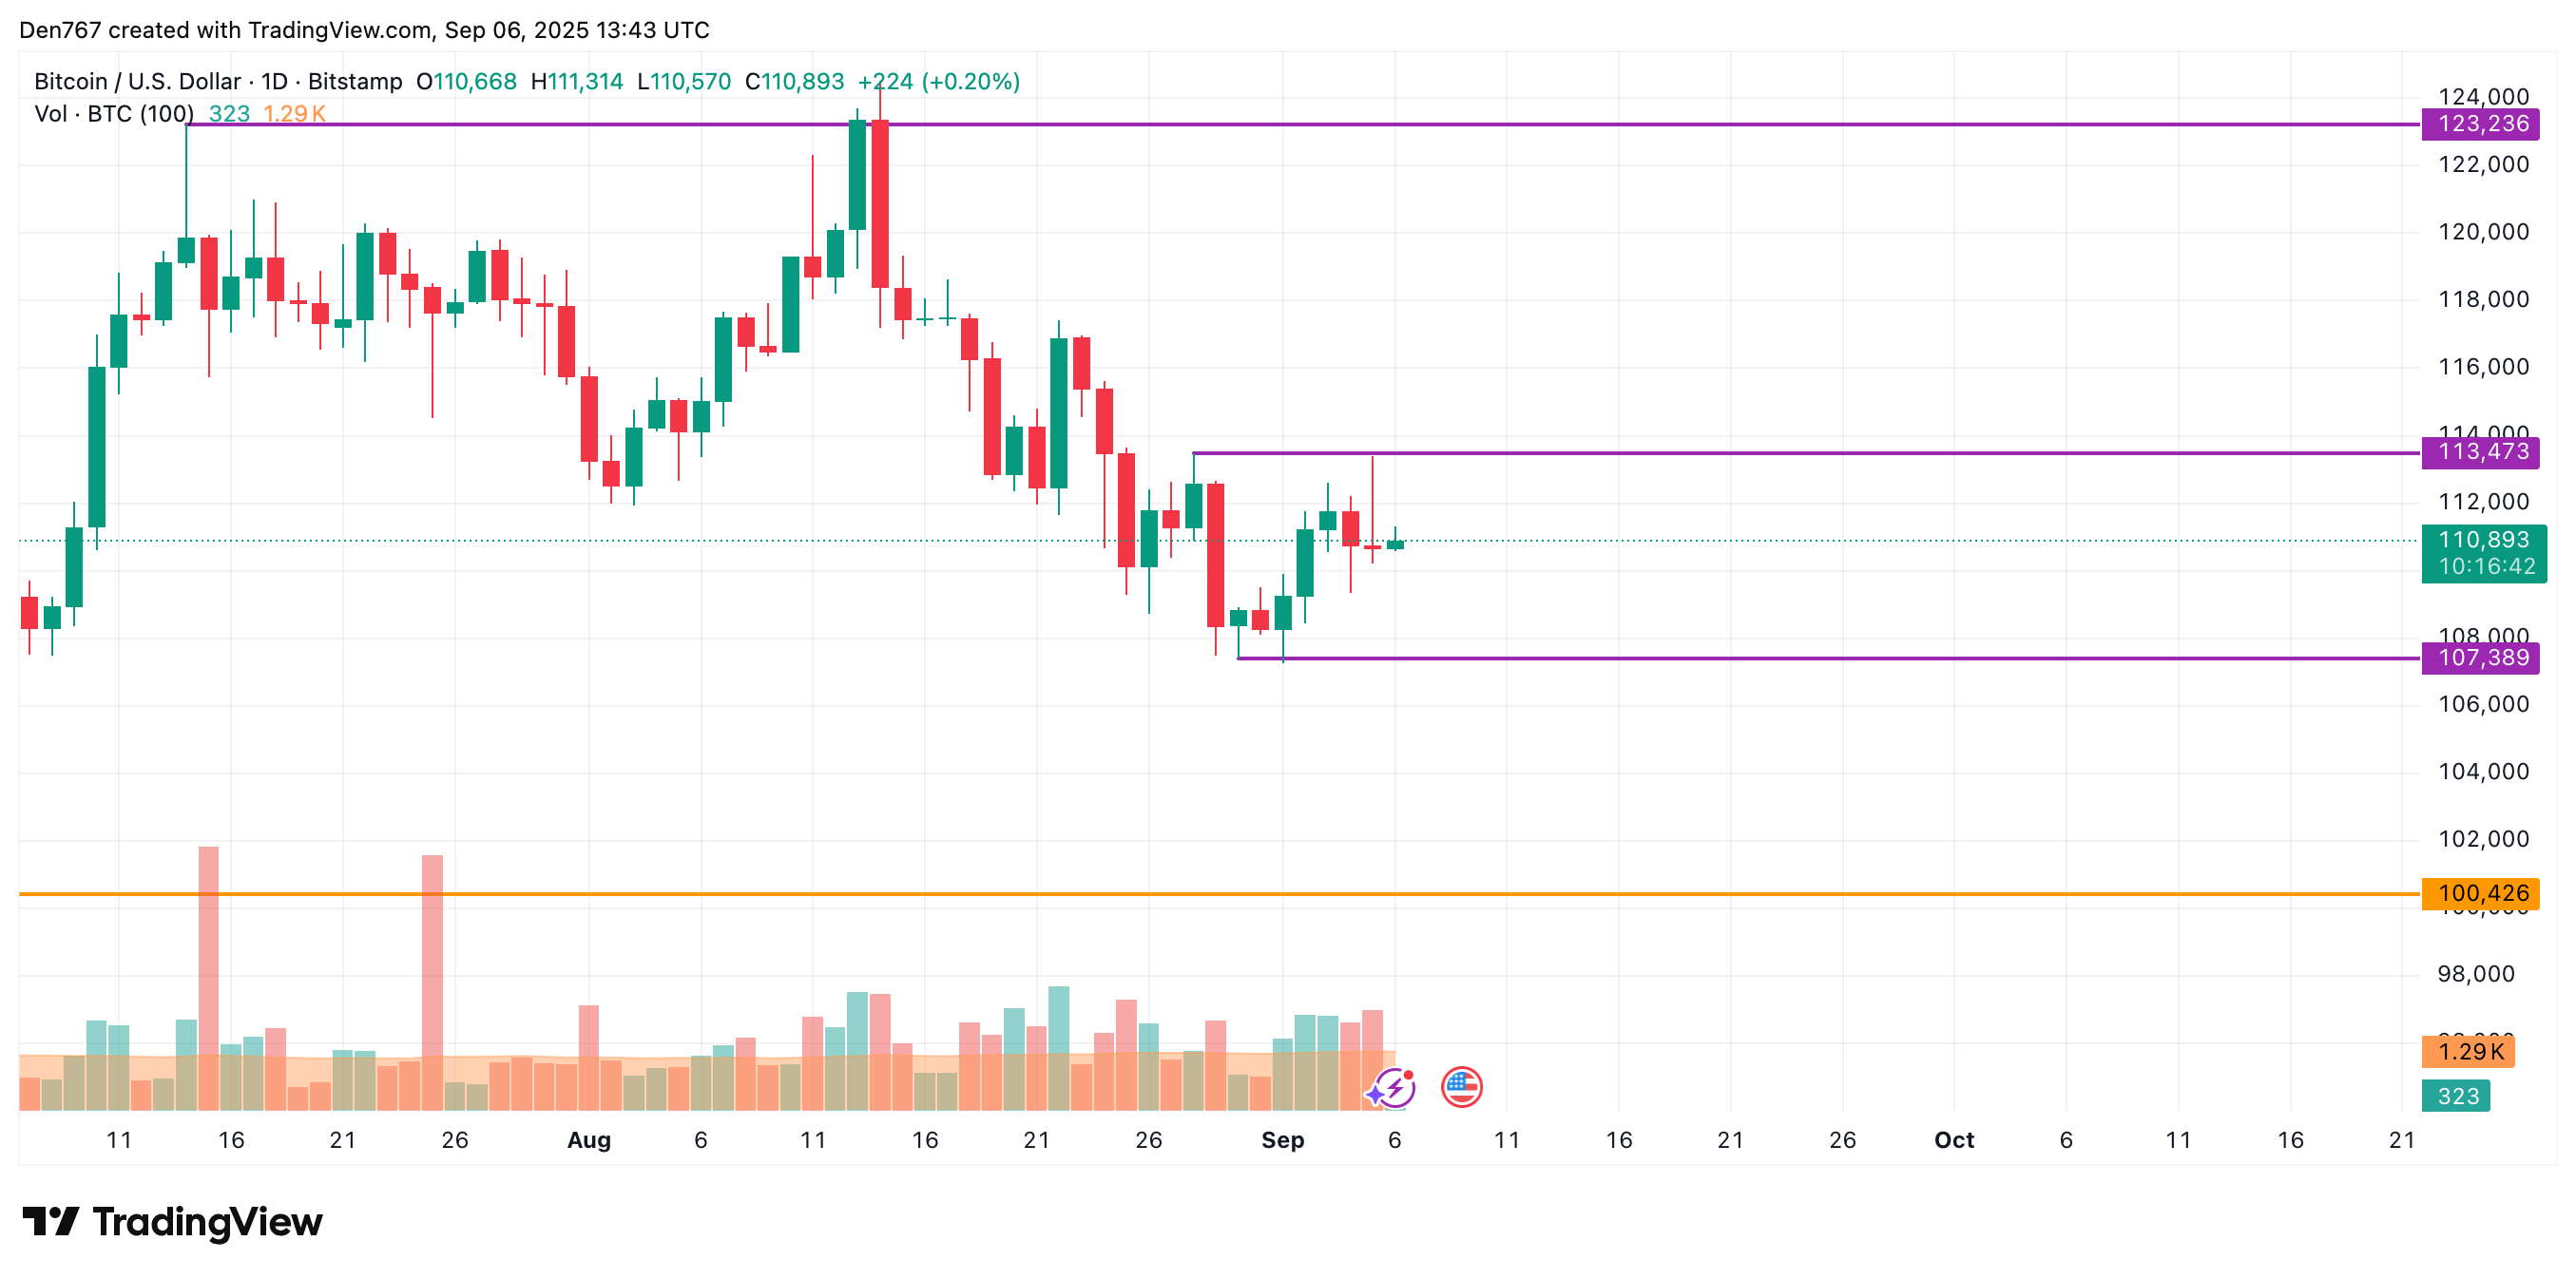
On the bigger time frame, neither side has seized the initiative so far.
As neither buyers nor sellers are dominating, ongoing sideways trading in the range of $110,000-$112,000 is the more likely scenario.
From the midterm point of view, traders should pay attention to the nearest level of $107,389. If a breakout happens, the fall may lead to a test of the support of $100,426 soon.
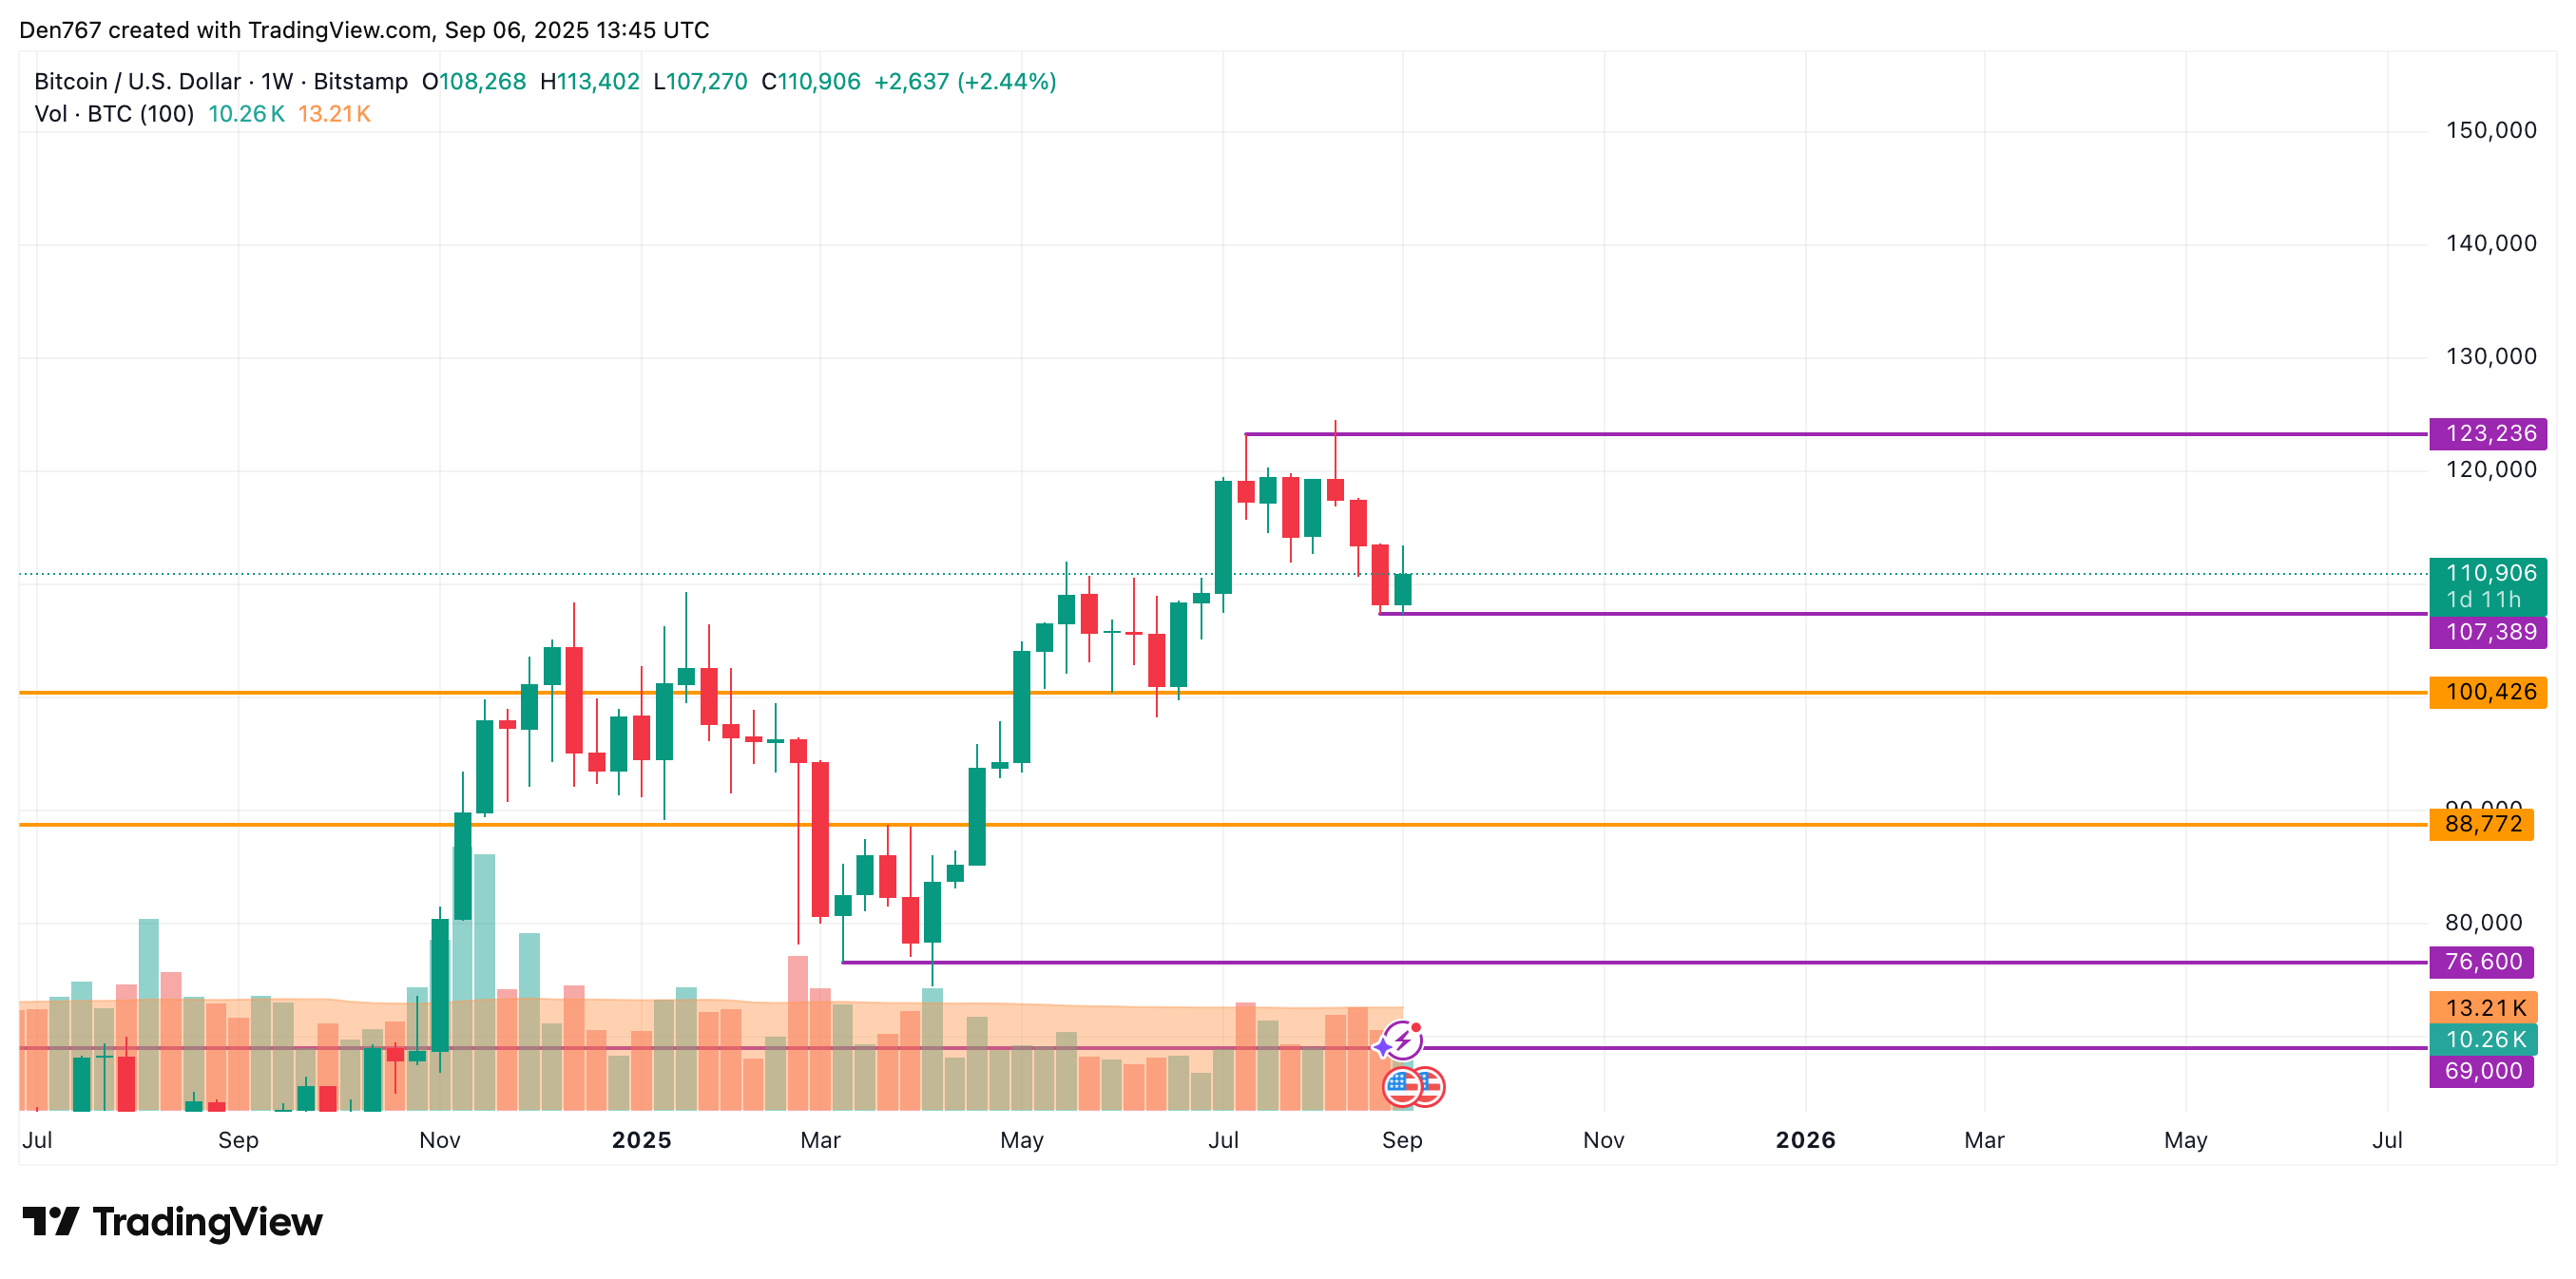
Bitcoin is trading at $110,906 at press time.