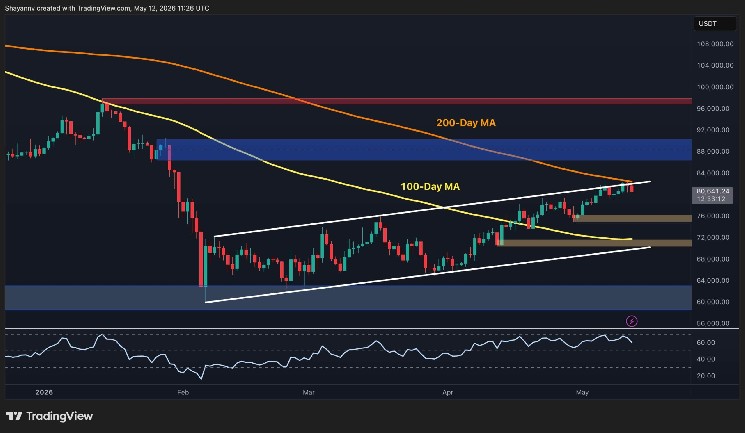
Bitcoin is currently trading at $80.8k, maintaining a position just above the significant psychological level of $80k, which has marked the upper limit of this cycle’s correction for several months. While the upper boundary of the ascending channel remains intact, it’s important to note that the price has significantly deviated from its 100-day moving average. The market’s response to where it converges with the 200-day moving average will likely dictate trends in cryptocurrency over the coming weeks.
Bitcoin Price Analysis: Daily Chart Overview
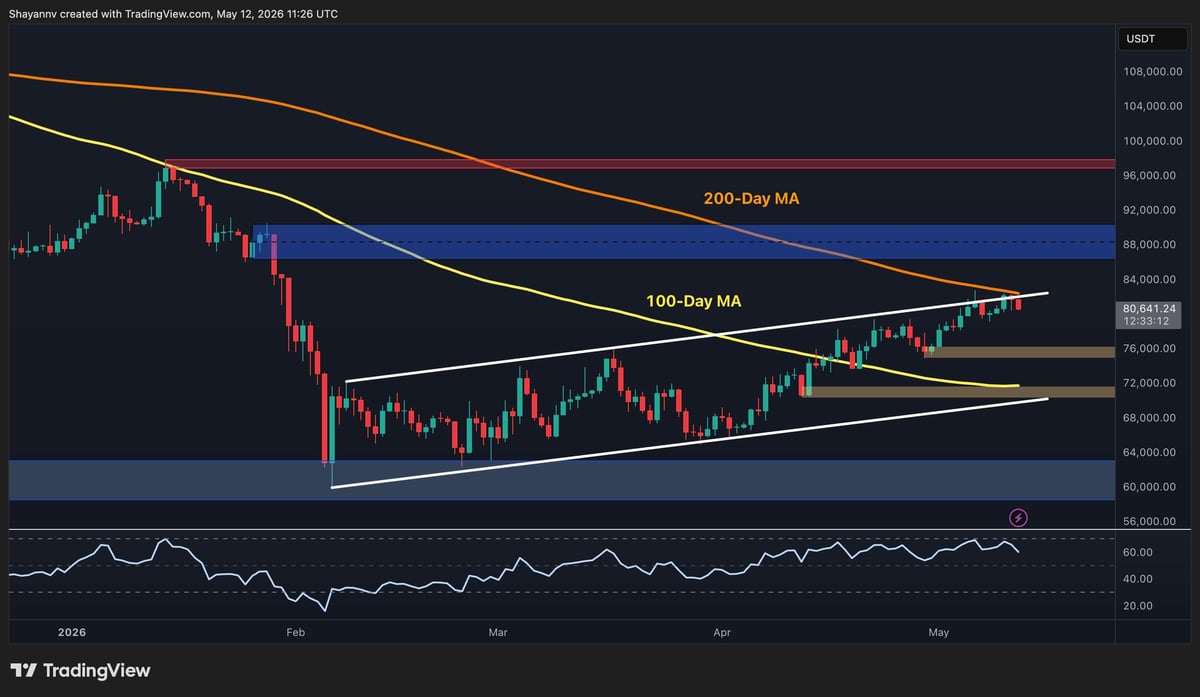
In examining daily charts, we see that Bitcoin is once again testing its ascending channel’s upper trendline while also nearing a critical point around $82k due to its alignment with the 200-day moving average. Below this level, we find that the flattening 100-day moving average near $72k could signal a potential shift towards a bullish mid-term market structure. Currently, Bitcoin is consolidating just beneath both this channel’s upper boundary and its corresponding 200-day MA; meanwhile, RSI levels are stabilizing between 60 and 65 after experiencing two retracements from nearly overbought conditions.
The support zone established at $76k—formed by a bullish order block during recent price surges—will be crucial to defend if any pullbacks occur. Additionally, resistance levels can be found at both the ascending channel’s top and near where it intersects with both moving averages around $80k–$82k.
A daily close above this pivotal area would represent one of the most significant structural developments seen throughout this entire cycle and could pave an avenue toward reaching resistance levels between $88k–$90k. Conversely, if Bitcoin closes below $76k on any given day, it may indicate an initial sign of weakness in what was previously perceived as a breakout.
BTC/USDT Four-Hour Chart Insights
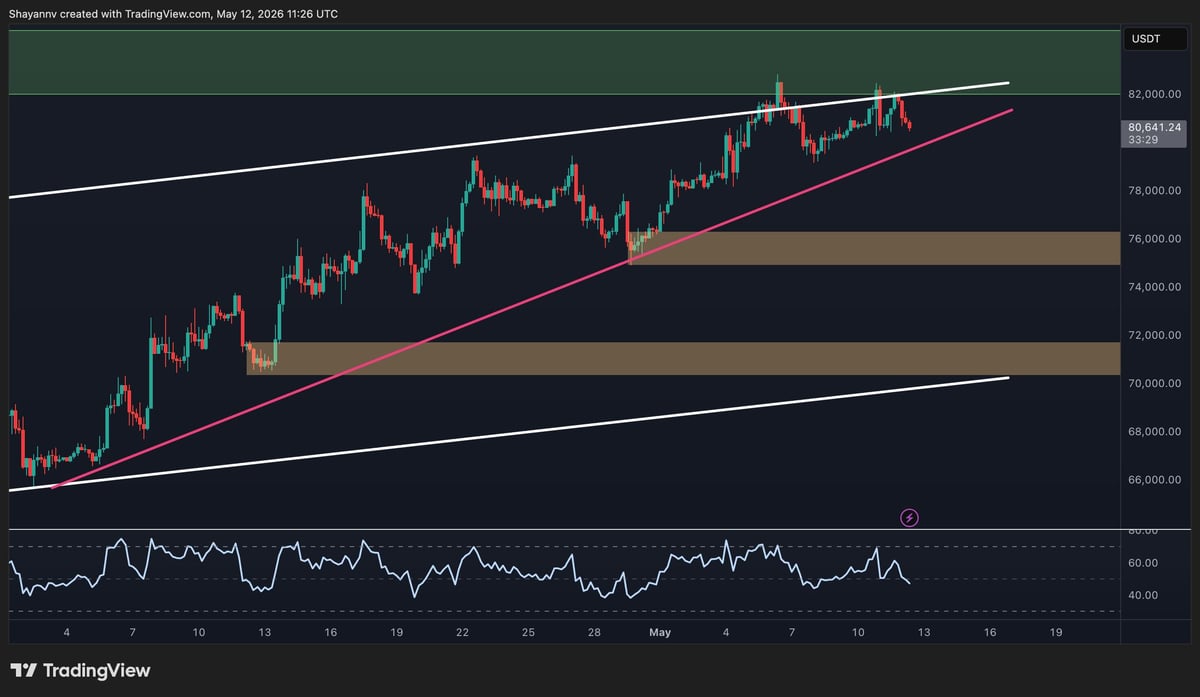
The four-hour chart reveals that within our larger trend channels lies a steeper pink trendline acting as dynamic short-term support; prices have rebounded off this line near $76K before surpassing through key resistance above $80K. The RSI has cooled down from recent highs and now hovers around neutral territory (50), indicating healthy consolidation without signaling any substantial deterioration unless it drops significantly below that mark.
This short-term range appears well-defined by both an ascending trendline along with support created by previous lows around brown zone ($76K). Should prices dip below these thresholds though they may expose demand zones located between approximately $70K-$72K while encountering supply pressures nearer to the upper boundaries set forth earlier ($82K).
A four-hour close exceeding $82K alongside recovering RSI values towards 65 would suggest positive resolution out of current consolidation phases leading potentially into rallies targeting high-eighty-thousands regions ahead!
Market Sentiment Analysis
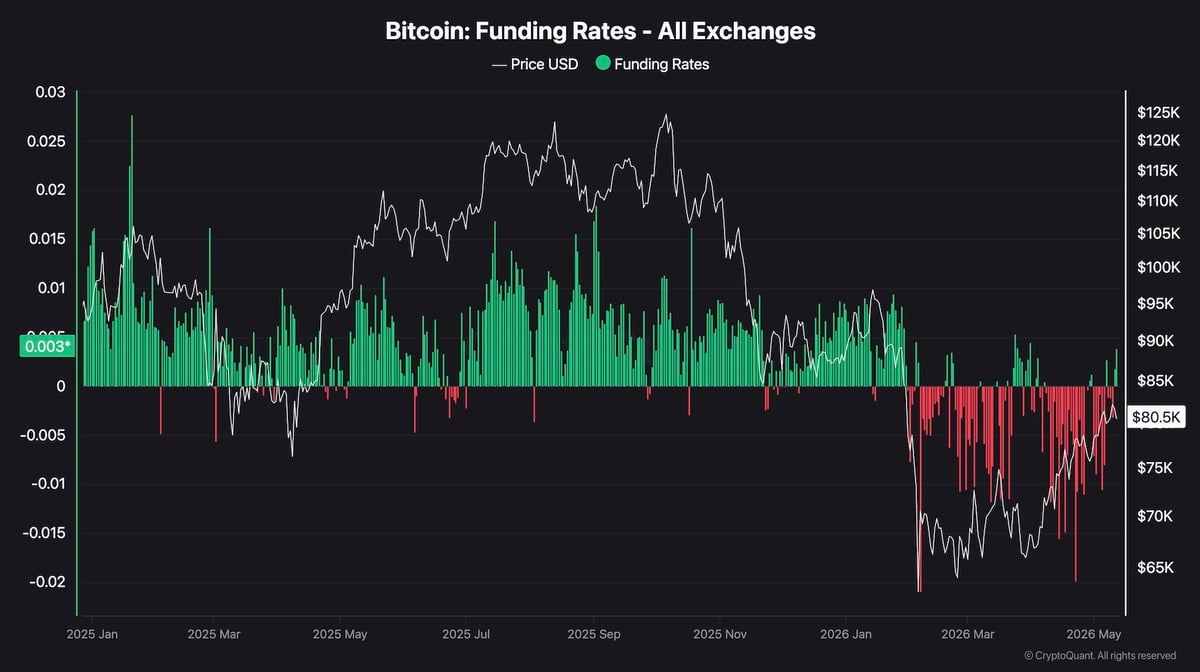
The funding rate chart recently displayed some mildly encouraging positive readings after enduring weeks filled predominantly negative metrics accompanying recovery efforts since dropping under-$70-K thresholds up until present pricing scenarios unfolded! This transition serves not only as data but also signals shifts within overall market psychology among traders involved here too!
This cohort who remained net-short throughout much prior rallies have either faced liquidation or capitulation events occurring lately allowing fresh long positions now starting accumulate consistently priced above current markers ($80-K+). Although still modestly rated (+0 .003) compared against historical benchmarks observed during previous bull runs (often exceeding +0 .010), ample room exists for further growth before overheating conditions typically arise prompting corrections ahead!
FAQ
- What does Bitcoin trading at $80.8K mean?
It indicates that Bitcoin is currently valued just above $80 thousand which represents an important psychological threshold for traders. - If Bitcoin closes above $82K what happens next?
A closing price beyond $82 thousand could signify strong upward momentum potentially pushing prices toward higher resistance bands like $88-90 thousand range. - How do Moving Averages influence crypto trading?
Moving averages help identify trends; when prices interact closely with them (like crossing or bouncing off), they can indicate potential reversals or continuations in directionality within markets! - If BTC falls below $76 K what should I expect?
Should BTC drop beneath$76 thousand consistently on closing basis might hint towards weakening breakout dynamics possibly leading back into lower demand zones like those seen earlier ($70-72 K).