As of Monday, Bitcoin ($BTC) is trading lower, hovering below the $81,000 mark after experiencing a notable increase of over 4.5% last week. The bullish momentum for $BTC has been significantly bolstered by institutional demand, particularly with spot Exchange Traded Funds (ETFs) seeing their sixth consecutive week of inflows. However, renewed tensions in the Strait of Hormuz have dampened risk sentiment and overshadowed previous optimism regarding a potential US-Iran peace agreement, which has limited further upside for the leading cryptocurrency.
Institutional Demand Fuels $BTC‘s Price Surge
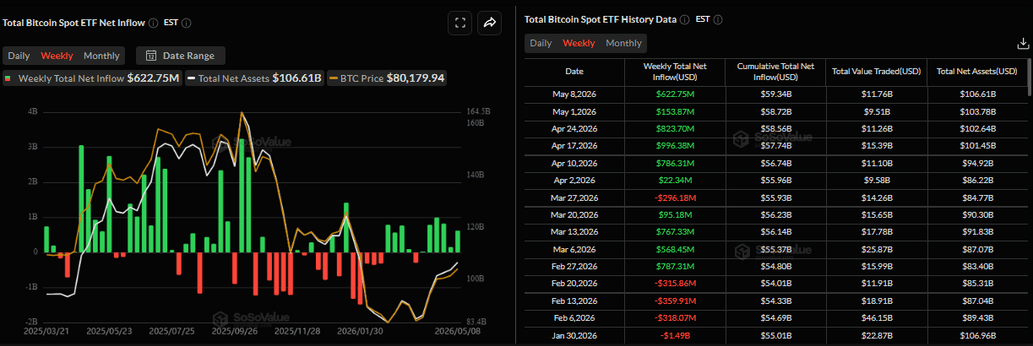
The price increase observed in Bitcoin last week can be attributed to robust institutional interest. Data from SoSoValue indicates that Bitcoin spot ETFs recorded impressive weekly inflows amounting to $622.75 million—marking six weeks straight of positive flows. Should this trend persist and intensify, there is potential for additional gains in $BTC.
Total Bitcoin spot ETF net inflow weekly chart. Source: SoSoValue
Geopolitical Tensions Restrain $BTC‘s Upward Movement
The prevailing risk sentiment took a hit as hopes surrounding a possible US-Iran peace deal quickly diminished due to escalating hostilities in the Strait of Hormuz.
Both US President Donald Trump and Iranian officials dismissed each other’s proposals aimed at ending ongoing conflicts while significant disagreements regarding Iran’s nuclear program lingered.
A report from the Wall Street Journal revealed that Iran has rejected American demands to dismantle its nuclear facilities or halt uranium enrichment activities for two decades—a response that Trump deemed “totally unacceptable.”
This recent escalation keeps geopolitical risks at play and suppresses investor appetite on Monday, causing assets like $BTC$ to experience slight corrections.
Emerging Concerns Signal Caution
An alert from Whale Alert on X indicated that an inactive wallet containing 500 $ BTC worth approximately $40.71 million was activated after being dormant for over 12 years; however, the reason behind this transfer remains ambiguous. Occasionally such transfers are made simply for address management or security purposes without raising alarms; yet if these coins find their way onto exchanges (to realize profits), it could amplify short-term selling pressure on $ BTC .
Santiment data also revealed significant outflows from Tether (on Ethereum), recording its largest exchange outflow in about three months last Friday with -1.29 billion net $ USDT leaving exchanges.
Typically speaking stablecoin outflows indicate traders withdrawing buying power rather than actively engaging capital into immediate crypto purchases or keeping funds readily available for trading purposes.
A Santiment analyst noted “However large outflows like these generally reflect actions taken by institutional investors or whale-tier participants moving funds into self-custody wallets DeFi protocols or OTC desks ahead of larger planned maneuvers—it’s repositioning capital not exiting entirely.”
Traders should monitor these spikes since similar trends have historically preceded short-term market corrections—as illustrated below when massive withdrawals occurred on February 9 coinciding with mild pullbacks seen over subsequent weeks before establishing strong buying opportunities around February 24.
The price forecast indicates rejection near overhead supply levels. The highest weekly close since February was recorded at $$82’210 up by four point sixty-three percent during last week’s trading session however despite attempts made towards reclaiming key resistance levels set forth through one hundred-week exponential moving averages positioned around eighty-two thousand four hundred sixty-seven dollars efforts fell short ultimately resulting once again downwards trending prices currently resting just above eighty thousand nine hundred dollars as we begin our current trading period today.
If downward movements persist they may extend towards psychological support zones established near eightytwo-thousand dollar marks slipping beneath those thresholds could potentially lead us back downwards toward Fibonacci retracement points situated closer towards seventy-eight thousand four ninety ($78’490) calculated based off previous highs witnessed earlier this year reaching peaks upwards exceeding one-hundred twenty-six-thousand ($126’199).
MOMENTUM INDICATORS ARE MIXED BUT IMPROVING AS THE RELATIVE STRENGTH INDEX RANGES AROUND NEUTRAL VALUES NEAR FORTY-NINE WHILE MOVING AVERAGE CONVERGENCE DIVERGENCE HISTOGRAMS REMAIN POSITIVE SUGGESTING BULLISH PRESSURES TRYING TO REASSERT THEMSELVES DESPITE RECENT CONSOLIDATIONS OCCURRING WITHIN MARKET PLACES OVER TIME.
$btc/$usdt WEEKLY CHART
Pricings observed within daily charts maintain constructive bullish biases indicating upward movements likely remain intact while holding above fifty-day & one-hundred day exponential moving averages clustered around mid-seventy-six thousands levels coupled alongside fifty percent retracement lines drawn connecting January highs through february lows respectively thus confirming solid foundations existing underneath current valuations established recently along pathways traversed throughout prior sessions encountered previously across various markets globally.
Immediate technical caps arise nearing two-hundred day EMA located roughly close towards eighty-one-thousand seven-ninety-eight USD preceding denser resistances formed via Fibonacci retracements approaching figures surpassing eighty-three-four thirty-seven whilst horizontal barriers rest firmly positioned against them nearing upward crossings achieved later during intervals experienced subsequently thereafter ahead if maintained properly enough under favorable conditions seen hereafter henceforth remaining supportive measures upheld consistently thereafter likewise providing stability necessary fostering growth potentials anticipated going forward onward continuing onwards even beyond expected limits placed upon them presently now faced accordingly until further notice henceforward.
Q: What factors are influencing Bitcoin’s current price?
A: Institutional demand through ETFs is supporting its rise but geopolitical tensions are limiting further gains.
Q: How does ETF inflow impact Bitcoin?
A: Increased ETF inflows typically indicate growing investor confidence which can drive prices higher.
Q: What should traders watch regarding recent wallet activity?
A: Traders should monitor any large transfers from dormant wallets as they may signal upcoming selling pressure.
Q: Why are stablecoin outflows significant?
A: They often suggest reduced buying power among traders which might affect immediate crypto purchases.
Q:What technical indicators suggest about future movement?
A:The mixed momentum signals indicate potential consolidation but underlying bullish pressures remain present suggesting possible upward movement if support holds steady.
Cryptocurrency analyst Timothy Peterson has shared a remarkable seasonal analysis of Bitcoin’s price movements. According to Peterson, September 21st is…