Bitcoin is currently navigating a broader recovery phase after a significant rebound from the $60,000 mark. Despite recent bullish trends, the market faces challenges in reclaiming a crucial resistance level around $80,000, which is likely to be pivotal for its next major directional movement.
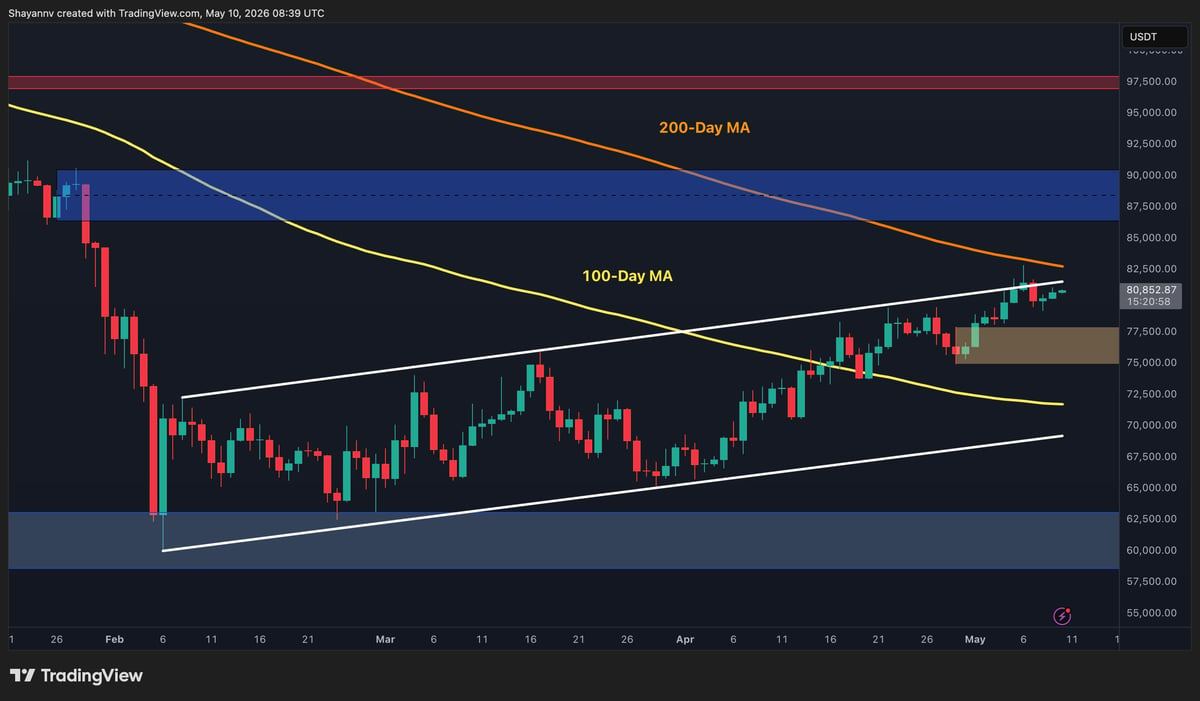
Bitcoin Price Analysis: Daily Chart Overview
On the daily chart, $BTC has been exhibiting volatile price movements near the critical $80K resistance zone. There appears to be insufficient bullish momentum for a confirmed breakout at this level. This area holds significant technical relevance as it coincides with the 100-day moving average, which reinforces selling pressure in current trading conditions.
The latest candlestick patterns indicate growing uncertainty and diminishing momentum as traders struggle to establish acceptance above this key threshold. Given the current market structure and repeated rejections within the $80K-$82K range, there seems to be an increased likelihood of a bearish reversal in the short term.
If buyers can unexpectedly drive prices above both the 100-day MA and break through the upper boundary of this price channel, we could witness a new short-squeeze scenario that might propel $BTC towards reaching significant resistance at $90K.
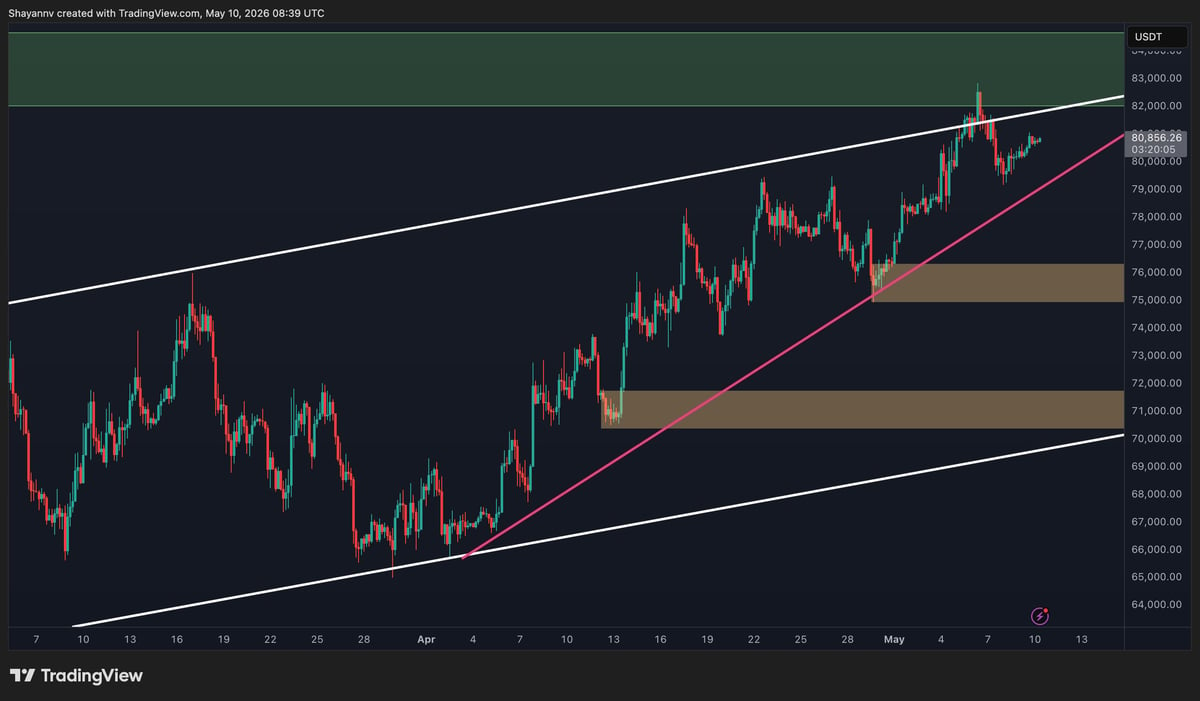
$BTC/USDT 4-Hour Chart Analysis
The 4-hour chart reveals that Bitcoin remains ensnared within a narrow consolidation range defined by an ascending dynamic trendline below and static resistance between $80K-$83K overhead. This configuration illustrates a temporary balance between buyers and sellers following its recent upward surge.
As long as Bitcoin’s price stays within this range, further sideways consolidation is anticipated. The ascending trendline near $78K serves as vital short-term support for buyers; however, if there’s any bearish rejection leading to breakdowns below this trendline, it could trigger corrective declines toward lower order block areas around $75K-$76K or even down into support levels around $70K-$71K.
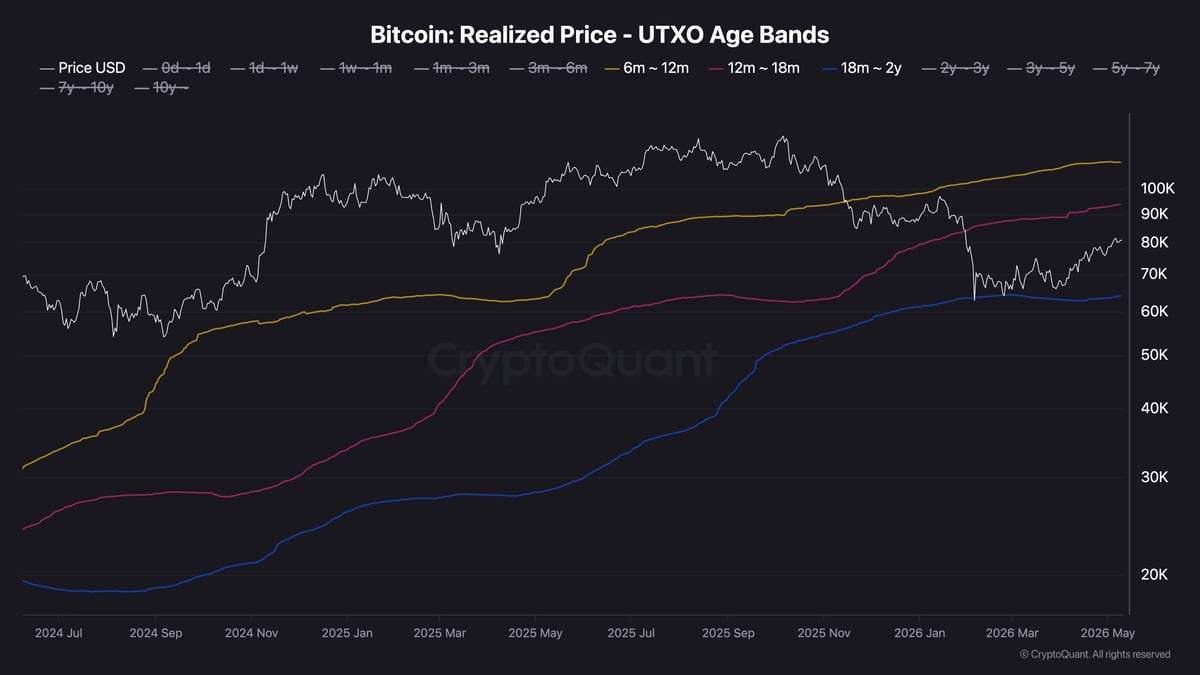
Onchain Analysis Insights
An on-chain analysis perspective indicates that realized prices among long-term holders remain one of Bitcoin’s most critical macro support and resistance indicators. These realized price levels are essential because they determine whether specific holder cohorts are operating at profit or loss—this significantly impacts their behavior in markets.
Pursuing these insights further reveals that Bitcoin trades between realized price bands from cohorts aged 12 months to two years—approximately ranging from $62k up to about $92k. Historically speaking, maintaining positions above these realized prices reflects stronger confidence among holders while reducing sell-side pressure; conversely losing these levels often leads toward broader market weakness. Thusly identified ranges play an important role in forecasting Bitcoin’s upcoming macro trends directionally moving forward.
FAQ:
- What factors influence Bitcoin’s price movements?
- The primary factors include market demand/supply dynamics, investor sentiment shifts influenced by news events or regulatory changes along with technical analysis indicators such as moving averages or Fibonacci retracements amongst others!
- How does on-chain data affect trading decisions?
- This data provides insights into holder behaviors based upon their profitability status thus impacting overall supply/demand metrics affecting pricing strategies employed by traders!
- Are there any potential risks associated with investing in cryptocurrencies like BTC?
- Certainly! Risks encompass high volatility leading towards rapid losses/gains alongside regulatory uncertainties plus security vulnerabilities tied directly back towards exchanges where trades occur!
- What should I consider before investing?
- You should assess your risk tolerance level carefully understand how cryptocurrency fits into your investment portfolio strategy ensure you conduct thorough research prior engaging actively trading activities!
<![CDATA[
]]