
Bitcoin ($BTC) is nearing two significant resistance levels that could dictate its upcoming market trajectory, as highlighted by cryptocurrency analyst Michael van de Poppe.
In a post on X dated May 9, the analyst pinpointed the first critical resistance zone between $86,000 and $88,000. The second and more crucial area lies between $93,000 and $95,000, which coincides with Bitcoin’s 50-week moving average (MA).
Poppe observed that in previous market cycles—specifically those of 2017, 2021, and now in 2024—Bitcoin’s initial recovery rallies frequently encountered rejection near prior support levels or at the 50-week moving average before establishing a sustainable upward trend. He suggested that the current situation mirrors this historical pattern.
The analysis indicated that Bitcoin recently fell below its 50-week moving average while finding long-term support around the low $70,000 range due to the influence of its 200-week moving average.
This insight also identified the range of $93,000 to $95,000 as a probable resistance area where sellers might regain control if bullish momentum diminishes.
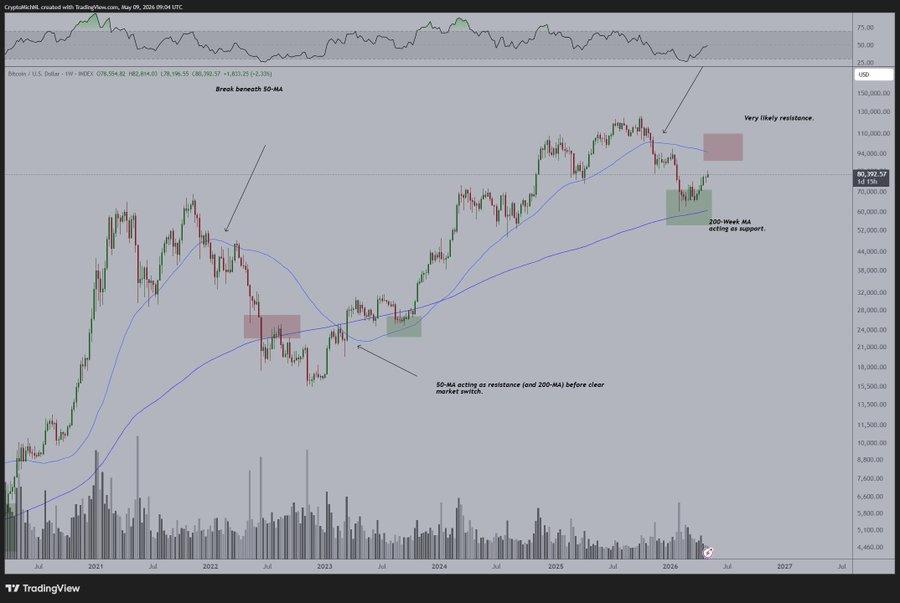
The forecast suggests Bitcoin may consolidate beneath these resistance levels for several weeks—a pattern reminiscent of past cycles where extended periods of sideways movement preceded broader upward trends and allowed altcoins to outperform their larger counterpart.
Furthermore, Poppe mentioned that Bitcoin might still revisit the range between $70,000 and $75,000 before making further advances; however he believes we have already seen the bottom for this broader bear market phase.
Decline in Bitcoin Exchange Reserves
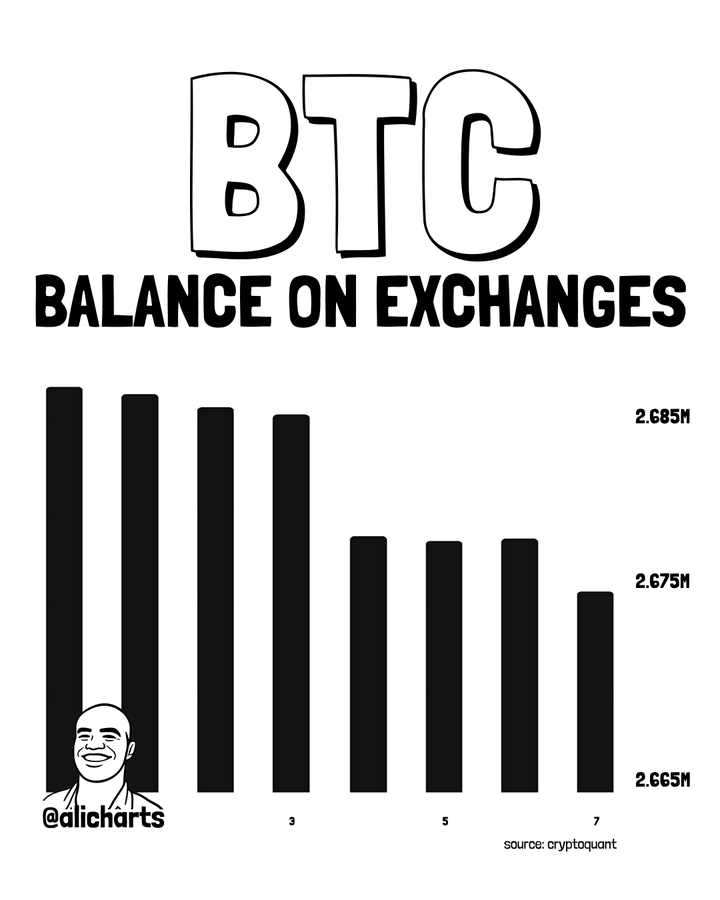
Additively reinforcing this long-term bullish sentiment is on-chain data shared by analyst Ali Martinez on May 8. Martinez noted approximately 7,400 Bitcoins were withdrawn from exchanges over just one week—a trend typically linked with diminished immediate selling pressure as investors transfer their assets into private wallets for longer retention periods.
The data indicates a steady decline in Bitcoin reserves across trading platforms toward a level around 2.675 million BTC.
This historical context shows that decreasing exchange balances often align with stronger price support since fewer coins available on exchanges can limit short-term sell-side liquidity while enhancing bullish momentum if demand remains high.
An Overview of Bitcoin Price Trends
This optimistic outlook comes amidst recent price movements showing modest gains throughout this week but remaining somewhat volatile overall.
A brief dip below $80K was followed by recovery efforts; over three months’ time frame,$BTC has surged from roughly$63K into an approximate$80K territory—indicating solid recovery despite still being significantly lower than its all-time high above$125K reached earlier within this cycle .
As per current reports , bitcoin trades at about$80 ,780 — reflecting an increase close to0 .5 %in last twenty-four hours . On weekly basis , asset gained nearly three percent .

Recent sessions have shown relatively contained volatility , leading analysts watchful for potential breakout towards85 K should favorable catalysts like continued ETF inflows alongside supportive technical indicators persist .
FAQ:
- What are key resistance zones for Bitcoin?
- The first key zone is between $86k-$88k; another significant one lies between $$93k-$95k aligned with its MA.
- Why are declining exchange reserves important?
- A decrease usually indicates reduced selling pressure which can lead to stronger prices due fewer coins available.
- If I want to invest in BTC now what should I consider?</li
- You should monitor both technical indicators & news regarding ETFs or other catalysts affecting demand.
- If BTC retests lower ranges will it be bad news?</li
- Not necessarily; it could provide buying opportunities before future increases .