
On May 9, Bitcoin is trading at $80,400, forming a rising wedge pattern on the daily chart. Notably, 85% of the upper CME gap has been filled. Analysts caution that liquidation clusters are accumulating below the current price level and warn that FOMO-driven long positions could become vulnerable.
Bitcoin 4H Chart: Rising Wedge with Potential Traps Below
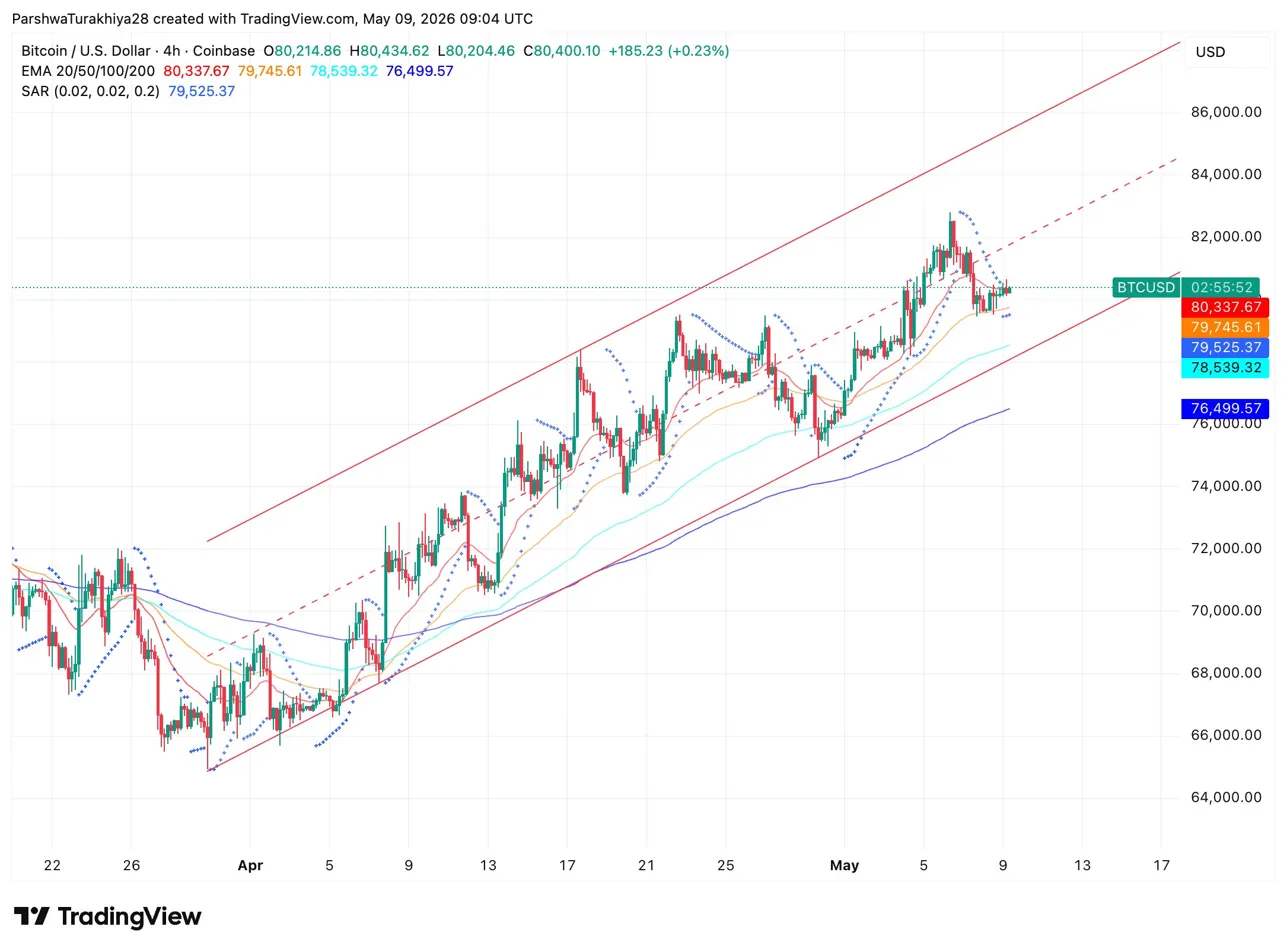
The four-hour chart indicates that $BTC has been moving within a clear ascending channel since hitting lows around $65,000 in April. Currently, it is testing the upper boundary near $82,000. The immediate support level lies at the 20 EMA of $80,337—just beneath its current trading price. Meanwhile, the Parabolic SAR remains bullish at $79,525; however, momentum appears to be waning as it approaches this upper resistance.
🚨 $BTC HAS FORMED A RISING WEDGE PATTERN
Bitcoin has already filled 85% of the upper CME gap while lower CME gaps remain unfilled.
A significant number of liquidation clusters are developing below current prices.
The extreme FOMO among traders who entered long positions during… pic.twitter.com/29FbBgXEGU
— CryptoJack (@cryptojack) May 9, 2026
Analyst CryptoJack pointed out that while $BTC has successfully filled most of its upper CME gap (85%), there are still unfilled lower gaps and growing liquidation clusters beneath present prices. Traders who jumped into long positions above $80K due to FOMO may find themselves exposed if institutional players decide to liquidate before pushing higher.
Main Levels for $BTC :
Resistance levels include:
– Upper channel limit at $82K
– Completion point for upper CME gap at $84K
Support levels consist of:
– Immediate support from the 20 EMA ($80K)
– Parabolic SAR ($79K)
– Additional support from a hundred EMA ($78K)
Risk zone exists between dense liquidation clusters ranging from approximately $78K to $79K.
The Impact of JPMorgan’s Estimated Demand on Bitcoin Prices
An analysis by JPMorgan suggests that their strategy could lead them to accumulate up to an impressive total of $30 billion in Bitcoin this year if they maintain their current buying momentum. The most immediate catalyst contributing towards this figure is STRC returning to par value—a move which could prompt several billion dollars in new purchases almost instantly according to The Wolf of All Streets.
This recent narrative surrounding potential sales was addressed by Michael Saylor who clarified it should not be interpreted as bearish but rather as part of liquidity management strategies; any sale would likely coincide with larger net purchases within similar timeframes. Overall discussions from Consensus in June indicate Strategy’s capital structure supported by STRC’s yield mechanics will provide ongoing incentives for continued buying irrespective of short-term price fluctuations.
$30 Billion Buyer Implications for $BTC ‘s Price Dynamics:
If we consider annual purchases totaling $30 billion based on present pricing near $80k—that translates roughly into sustained demand equating about $575 million weekly! While such consistent bids do not guarantee linear upward movement—they certainly establish structural floors making significant retracements increasingly difficult to sustain over time.The Wolf noted during Consensus events how institutions prioritize building over merely observing market prices; Strategy’s ongoing purchasing activity exemplifies this trend clearly!
Additionally upcoming legislation regarding Clarity Act markup next week introduces further complexities—Polymarket odds concerning passage have surged dramatically—from just 46% up now standing tall at 71%! This reflects strong grassroots confidence observed among attendees despite remaining skepticism surrounding these developments overall!
Price Forecasts for Bitcoin on May 9:
Upside Potential:– Maintaining above $$80,$337 along with breaking through $$82,$000 opens pathways toward reaching targets situated around $$84,$000-$$$86,$000 range accelerating should STRC trigger associated purchase activities!
Downside Risks:– Closing under $$79,$525 SAR would likely result swift flushes occurring through existing liquidation zones found nestled between ranges spanning roughly $$$78,,$00-$,$79,,$00! Any breakdown seen past critical supports like those located around one-hundred EMAs ($,$78,,$539) brings renewed focus back onto previously discussed bear market confirmation lines positioned nearer toward values hovering close-by approximately $$$76,$00.
FAQ Section:
- What does a rising wedge pattern indicate? – A rising wedge typically signals potential bearish reversals when observed after an upward trend due its converging nature leading towards tighter price action often resulting ultimately either breakouts or breakdowns depending upon subsequent volume confirmations .
- Why is filling gaps important in trading? – Filling gaps can signify areas where traders previously had orders executed creating possible future resistance/support zones which play crucial roles determining future directional movements .
- How do institutional investors impact cryptocurrency markets? – Institutional investments tend generally create increased volatility alongside heightened interest providing both liquidity and credibility attracting more retail participants subsequently driving trends upwards/downwards significantly !
- No risk without reward? How can I manage my risks effectively ?
– Implementing stop-loss orders diversifying portfolios regularly reassessing trades based upon technical indicators alongside maintaining proper position sizing serve key purposes mitigating exposure whilst maximizing profitability opportunities! }