
Bitcoin’s resurgence above $82,000 has sparked optimism among investors. Nevertheless, a noteworthy technical analysis indicates that this rally might still be part of a corrective phase rather than the onset of a definitive bullish breakout.
This distinction is crucial as the analysis reveals that Bitcoin is nearing a resistance zone that could determine whether the upward movement persists or traps latecomers into buying.
Bitcoin Approaches Significant Resistance Zone
The price of $BTC surged back over $80,000 this week, buoyed by substantial inflows into Spot Bitcoin ETFs. However, crypto analyst Tara remains skeptical about whether this bullish trend captures the complete picture.
Tara’s perspective hinges on Bitcoin’s interaction with the macro 0.382 retracement level. According to her analysis, while Bitcoin has surpassed this level, it did so without establishing robust support beneath it first. This situation creates an environment where further price increases are possible but may lack stability due to insufficient foundational strength beneath the current rally.
Consequently, Bitcoin’s inability to solidify support after breaking through a critical macro Fibonacci level leaves it vulnerable as it approaches a major resistance area ranging from $85,200 to $93,000.
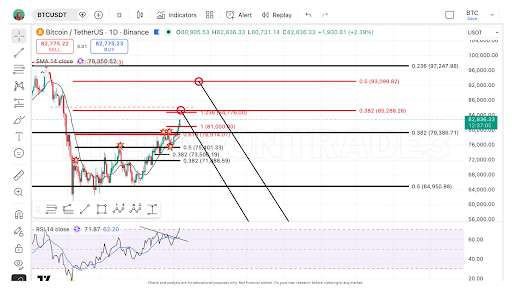
The short-term market structure has notably improved since early February lows around $60,000; however, Tara’s chart highlights several significant overhead levels now in play. The initial major red resistance line appears near $85,288 and aligns with the 0.382 retracement within her projected framework. Beyond that point lies another critical test at approximately $93,099 corresponding to the 0.5 retracement level.
Tara suggests that this ongoing rally represents Wave B within an overarching corrective ABC trend cycle. She characterizes Wave B as one of market cycles’ most misleading phases because it can lead traders to believe they have exited correction territory prematurely; however—crucially—the range between $85,200 and $93,000 marks where Wave B may begin losing momentum.
The Next Steps: Assessing Crash Risks
As Bitcoin nears its resistance threshold again—investors are left pondering what might occur if rejection happens at these levels; specifically what follows could result in declines punishing those who entered too late into trades.
The chart illustrates two potential downward trajectories stemming from upper resistance zones—one initiating around $85K and another closer towards reaching around$93K—with both suggesting any rejection here could push prices below$60K once more!
A sustained breakthrough past$85K would activate interest towards hitting up toward$93k region—and cleanly moving beyond there would likely diminish bearish corrections currently seen! As per latest updates,BTC trades at79k742 down by two percent over last twenty-four hours!
FAQ:
- What does recent technical analysis suggest about Bitcoin?
- This suggests that while there is bullish sentiment due to its rise above $82k,it may still be part of an overall corrective structure rather than indicative of sustained growth。
- If rejected at current resistances,what could happen next?
- A rejection might lead prices lower,potentially dropping below $60k for buyers who entered late。
- What key levels should traders watch for?
- Traders should monitor resistances around$85,200-93,000 as well as support established below them。