
Bitcoin has surged past the $81,000 mark, capturing the attention of global stock markets. During Tuesday’s trading session in Asia, Bitcoin exceeded this threshold for the first time since late January.
The cryptocurrency rose from around $79,000 at the close of U.S. markets on Monday, marking a weekly increase of 5.3%. Major global stock indices—including US Tech 100, Japan 225, S&P 500, and KOSPI—are also nearing their all-time highs.
Two distinct asset classes are currently at pivotal points; one is poised to influence the trajectory of the other.
Two Markets Facing One Question — Who Leads?
The correlation between Bitcoin and the S&P 500 has reached its highest level in three years as we enter 2023.
Typically when equity markets rise, Bitcoin follows suit; conversely, during downturns in equities, Bitcoin often experiences sharper declines.
A crypto analyst known as @AshCrypto illustrated this dynamic effectively through a series of parabolic charts that turned out to be representations of global stock indices rather than cryptocurrencies.
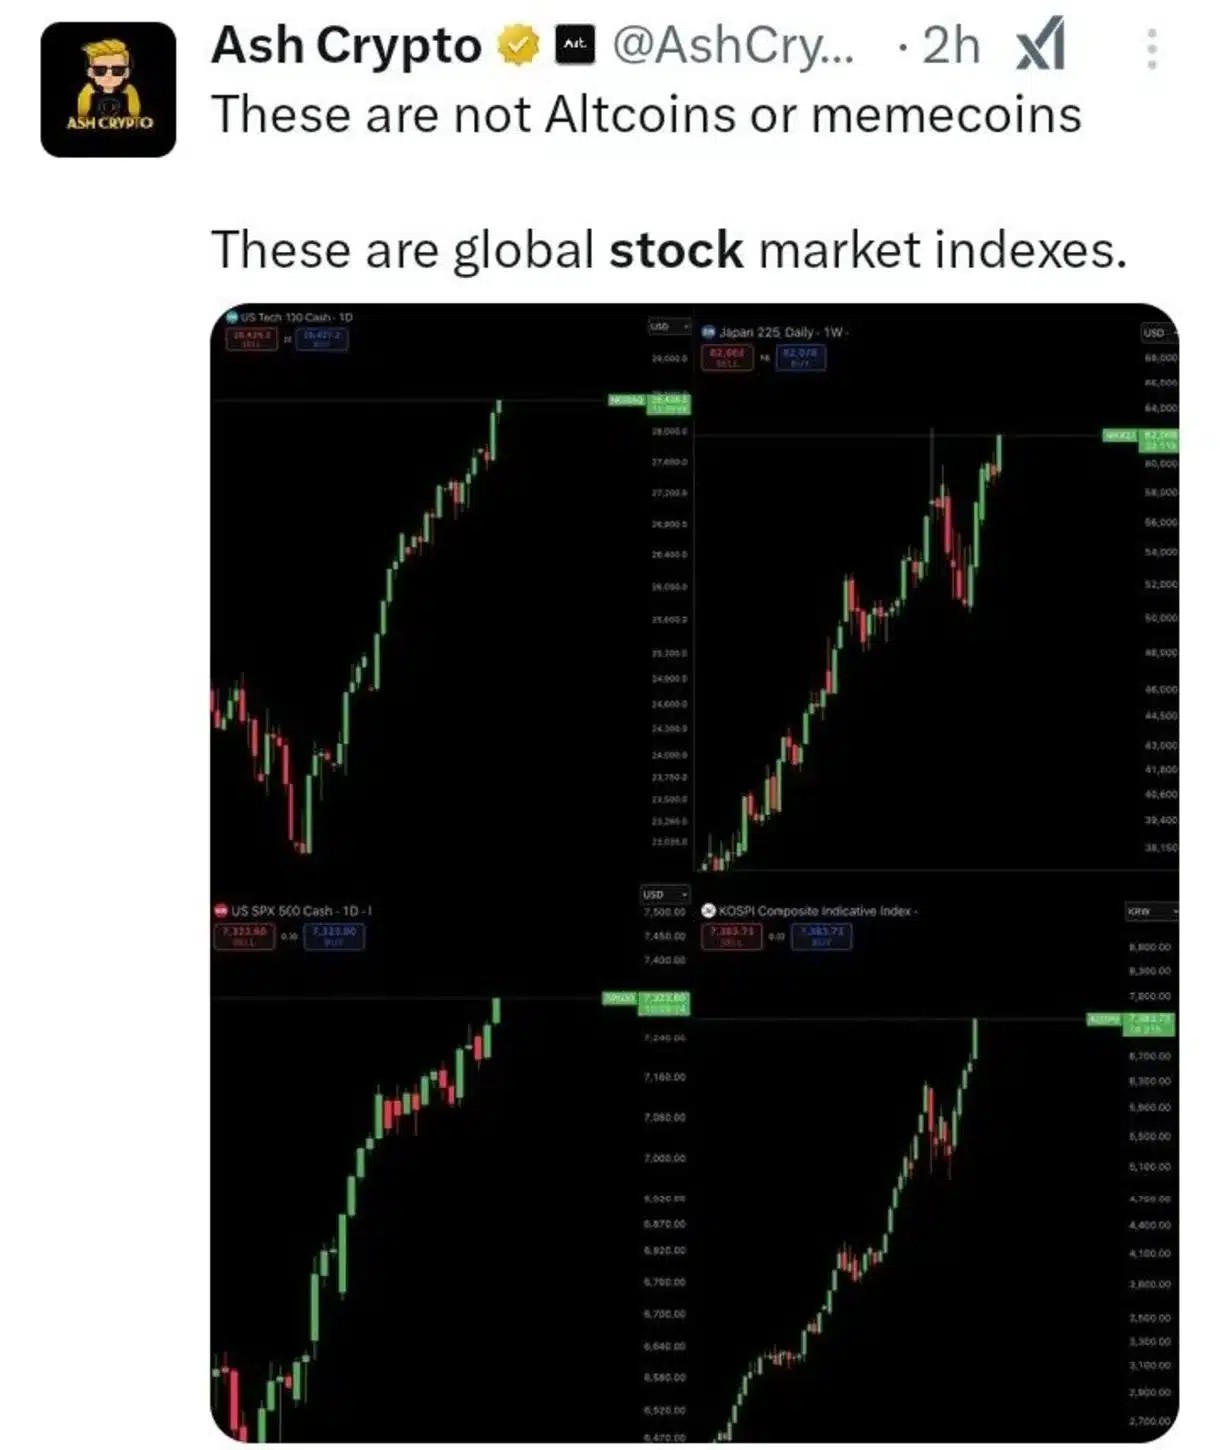
This observation highlights an important point: while stocks are climbing rapidly so is Bitcoin—but for increasingly divergent reasons.
This year’s geopolitical tensions have significantly influenced Bitcoin’s price movements more than any other factor observed thus far in 2026.
The breakthrough above $80K coincided with Trump’s announcement regarding Project Freedom and positive developments from U.S.-Iran negotiations. Iranian state media reported a peace proposal consisting of fourteen points with a thirty-day negotiation period established for discussions ahead.
The United States’ actions—such as escorting stranded vessels through strategic waterways—are being interpreted as signals aimed at de-escalation rather than conflict escalation.
Such behavior aligns more closely with safe-haven assets rather than correlated ones. Should Bitcoin maintain its position within low-$80K levels while equities begin to soften further downwards—the argument supporting it as a non-equity investment strengthens considerably.
However if it falters upon encountering new macroeconomic headlines—the rally may merely reflect high-beta risk behaviors instead representing any genuine shift within market identity itself.
The Chart Has Already Made Its Decision
As per BTCUSD (Weekly) data recorded on May 06th ,2026 (16:41 UTC), current trading stands at $81 ,677 .78 reflecting an uptick by +0 .96 % over last week’s performance . The Parabolic SAR remains positioned above price indicating that technically speaking weekly trends still exhibit bearish characteristics .
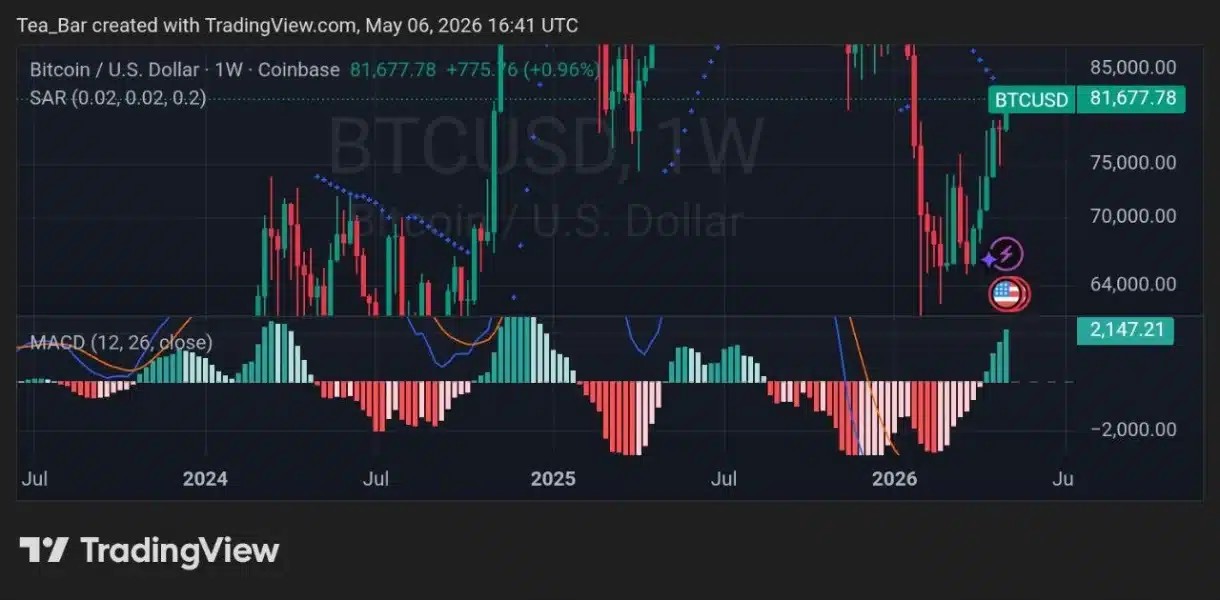
Despite this bearish trend however ,the MACD histogram shows aggressive expansion reaching +2147 .21 marking its most bullish reading since early twenty twenty-five ! Histogram bars continue growing taller & greener each passing week whilst both MACD & signal lines cross upward diverging away from compression patterns observed previously .
Every significant recovery seen across bitcoin since two thousand twenty-three has been anchored by precisely such patterns which aren’t just forming but already formed ! The next critical zone lies between eighty-two thousand – eighty-three thousand dollars where CryptoSlate ’ s ETF demand analysis correlates these levels directly towards potential breakout opportunities exceeding ninety-thousand dollars .
Upcoming Catalysts Marked On Calendar
Long-term holders now command seventy-eight point three percent share among circulating supply while MVRV Z-Score rests comfortably below cycle peaks sitting firmly at one point two – signaling no overheating present within market dynamics yet! April two thousand twenty-six witnessed strongest month ever recorded concerning U.S spot bitcoin ETF inflows accumulating net capital totaling approximately two billion four hundred forty million dollars !
A comprehensive peace agreement between USA-Iran finalized come May could provide clean risk-on boost propelling BTC beyond eighty-five-thousand into ranges approaching eighty-seven-ninety-thousand dollar thresholds!
Global stocks remain perched near peak values whereas bitcoin steadily builds momentum beneath own structure showcasing ongoing power struggle existing amidst these contrasting asset classes.
Disclaimer:
This article serves informational purposes only & does not constitute financial advice or guidance related investments/trading decisions made herein based solely upon publicly available data along with author interpretations prevailing during writing time frame involved herewith; Cryptocurrency marketplaces inherently possess volatility rendering unpredictability prevalent throughout them thus prior research should always be conducted alongside consultation from qualified advisors before engaging investments! TechGaged accepts no liability arising due losses incurred based off information presented herein!
Frequently Asked Questions (FAQ)
- What caused Bitcoin’s recent surge above $81K?
- The surge was primarily driven by geopolitical tensions and significant announcements related to U.S.-Iran negotiations along with Project Freedom led by Trump which created optimism among investors leading up towards higher prices!
- Aren’t cryptocurrencies generally correlated with traditional stocks?
- Certainly they can show correlations especially during bullish/bearish phases but lately we’ve noticed divergence occurring whereby each asset class responds differently depending upon underlying catalysts influencing them!
- How do technical indicators like MACD help predict future price movements?
- Technical indicators such as MACD assist traders/investors gauge momentum shifts over time revealing potential entry/exit points based on historical trends observed alongside current activity surrounding respective assets! They’re particularly useful when analyzing recovery patterns too!