
Bitcoin ($BTC) has experienced a remarkable recovery of 21% over the past month, propelling the leading cryptocurrency to surpass the $81,000 mark for the first time since January. Currently, $BTC is nearing a significant resistance level that could pave the way for further upward movement if it manages to close above this threshold on a daily basis.
Bitcoin Aims for $89,000 and $94,000
Technical analyst Ali Martinez recently highlighted this bullish momentum in a post on X (formerly Twitter), asserting that Bitcoin continues to exhibit “structural strength.”
Martinez pointed out a bullish Moving Average Convergence Divergence (MACD) crossover observed on Bitcoin’s weekly chart dated April 13. Since this signal emerged, $BTC has appreciated by approximately 15%, suggesting that the trend may be shifting rather than merely experiencing random fluctuations.
The significance of this weekly MACD crossover lies in its historical performance. According to Martinez’s analysis of previous occurrences, similar crossovers have often preceded substantial multi-month rallies.
The crossover from October 23, 2023 was followed by an impressive rally of 147%. Another instance on October 14, 2024 led to a rise of about 75%, while May 5, 2025 saw another crossover resulting in a gain of around 35%.
Despite these positive indicators within the broader market context, Bitcoin faces an immediate challenge. Martinez noted that Bitcoin is approaching its 200-day simple moving average (200SMA), currently situated at around $83,000.
This area is described as one of critical psychological and structural importance on daily charts. In his assessment, achieving a clean daily close above this level could trigger macro expansion towards targets at $89,000 and subsequently near $94,000.
Bull Market Support Band Reclaimed
Additionally enhancing the technical outlook is market expert Sam Daodu’s observation regarding Bitcoin’s Bull Market Support Band (currently at $79,000), which comprises both the 20-week simple moving average (SMA) and 21-week exponential moving average (EMA).
Doadu emphasized that historically when Bitcoin reclaims this band after being below it for an extended period; strong rallies typically follow—often exceeding gains of over 50% within months.
If such patterns hold true now as well; Daodu suggests that BTC could potentially reach around $121K—still just shy of last year’s all-time high near $126K achieved in October.
No matter how promising these signals appear; experts caution against complacency. Reports indicate it’s crucial for Bitcoin not only to reclaim but also maintain levels above these thresholds to sustain momentum going forward.
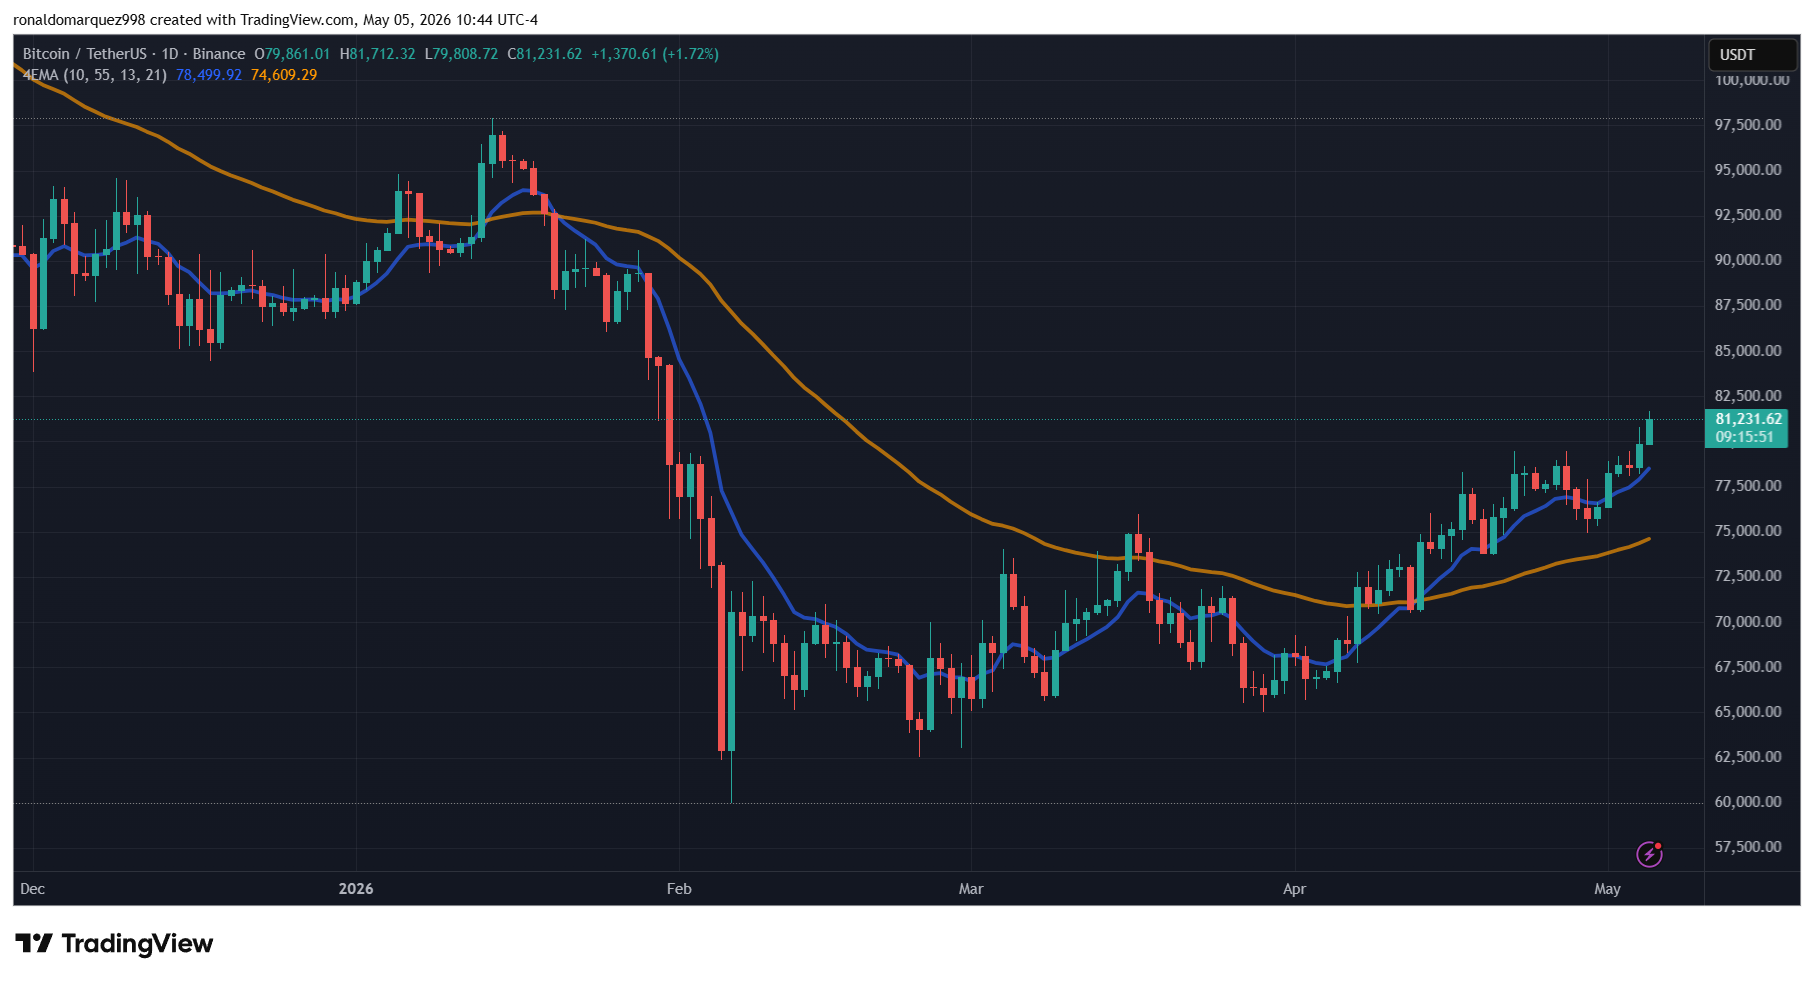
This featured image was created with OpenArt; chart sourced from TradingView.com
FAQ:
- <strongWhat factors contributed to bitcoin's recent price surge?: The recent price surge can be attributed primarily due to positive technical indicators like MACD crossovers along with reclaiming key support bands which historically precede major rallies.
- <StrongHow does bitcoin's current performance compare historically?: Historically speaking during similar conditions where significant MACD crossovers occurred prior instances have led up-to substantial multi-month gains ranging between roughly 35%-147%.
- <StrongWhat are potential future price targets for bitcoin?: Analysts suggest potential future targets include levels around $89k initially followed by approximately $94k depending upon sustained upward momentum.
- <StrongIs there any risk involved despite current bullish signals?: Yes! While many bullish signals exist caution remains necessary since maintaining prices above critical support levels will determine overall trend sustainability going forward.