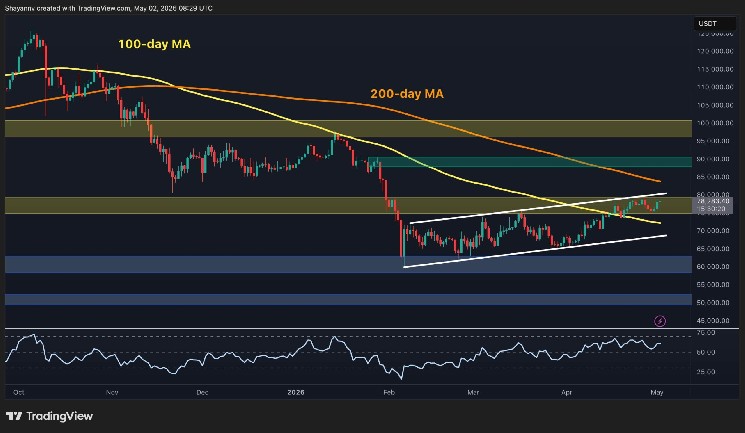
As the first weekend of May unfolds, Bitcoin is trading at $78.3k. This marks a significant achievement as it has successfully closed above the 100-day moving average (MA) and broken free from a long-term descending channel that had encapsulated its bearish trend.
This upward movement coincides with robust daily Relative Strength Index (RSI) readings, a successful retest of the breakout level on the 4-hour chart, and an on-chain supply analysis that clarifies why future challenges may arise—and why they could be worthwhile.
Bitcoin Price Analysis: Daily Chart Overview
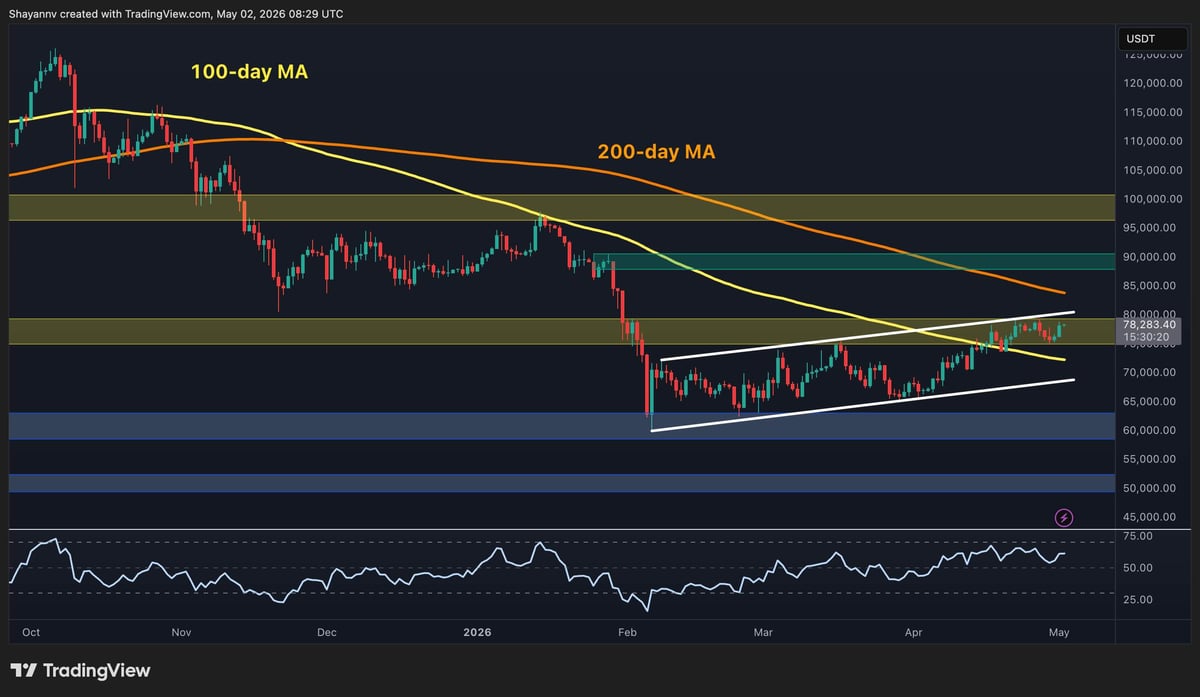
On the daily chart, $BTC is approaching the upper boundary of its mid-term ascending channel after reclaiming the 100-day moving average now situated around $72k. The RSI is trending upwards towards 70, indicating sustained bullish momentum while still allowing for further growth since it hasn’t reached overbought conditions yet.
The immediate challenge lies within the $80k supply zone, which has consistently capped prices during every attempt since February. A decisive daily close above this threshold would pave the way toward reaching $90k; however, resistance from the 200-day moving average near $85k also looms ahead. On a downside note, support begins at $75k—the lower boundary of this current range—followed closely by the critical support provided by the 100-day MA just beneath this level.
$BTC/USDT Four-Hour Chart Insights
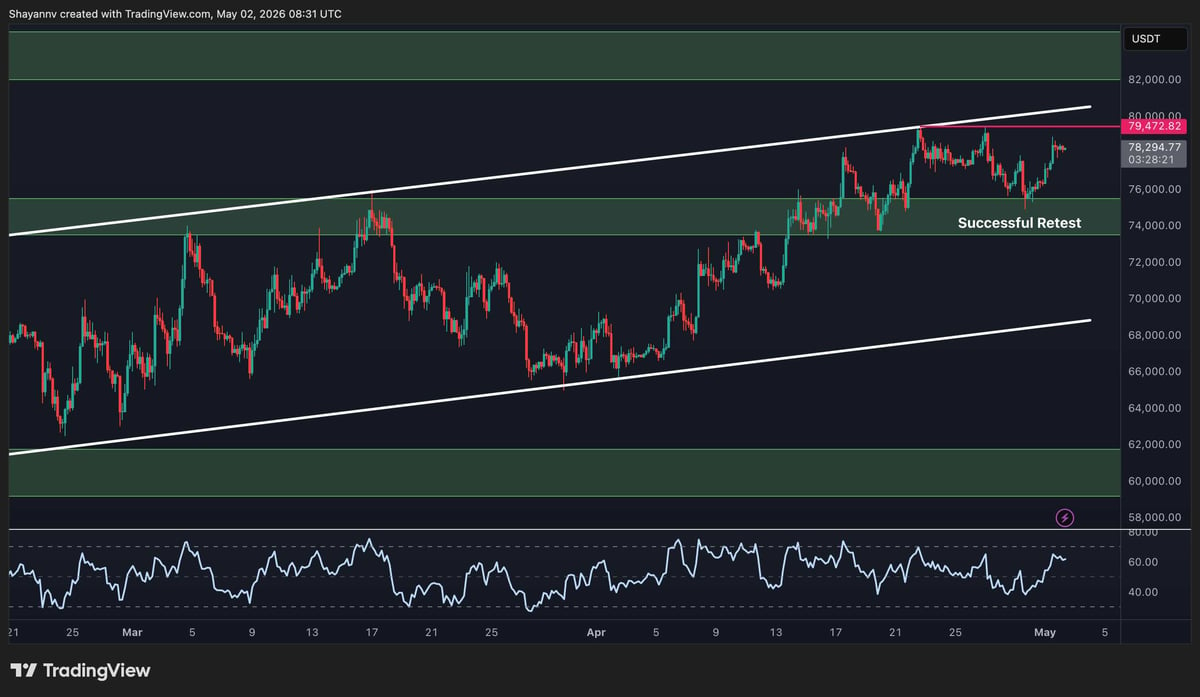
The four-hour chart illustrates a classic post-breakout structure. After breaking past $75k and subsequently retesting this level—clearly marked on our charts—the asset has surged back towards approximately $79k with RSI indicators climbing above 60 to signal an evident bullish shift in momentum. This clean structure reinforces confidence in continued upward movement following such retests.
The upper boundary of this channel converges with psychological resistance at around $80k as immediate ceilings to watch for price action changes. A four-hour close exceeding recent highs near $79.5K while maintaining RSI levels below overbuying thresholds will uphold bullish structures targeting between $$82K-$84K zones ahead; should any pullbacks occur again testing key support levels like that seen around $$75K becomes essential once more.
On-Chain Supply Analysis
A noteworthy statistic reveals that currently about 64.2% of Bitcoin’s circulating supply sits in profit—a substantial recovery since February’s lows—but it’s crucial to highlight that roughly one-third (35.8%) remains underwater financially illustrating deeper implications here than mere surface observations suggest . Most losses were incurred between price ranges spanning from $$80K up through $$125K during late-stage distribution phases observed back into early-to-mid-2025 making it evident $BTC now approaches breakeven territory where many holders may feel incentivized sell off their positions altogether if prices rise further upwards!
This dynamic historically indicates when crossing beyond seventy-five percent (75%-80%) profitability thresholds tends correlate strongly with diminishing overhead selling pressure leading corrections become less frequent allowing sustainable momentum build-up commence! Presently standing only sixty-four point two percent suggests we haven’t hit those pivotal points yet hence persistent ceiling pressures exerted across those key zones like eighty-thousand ($$80 K) – ninety-thousand ($$90 K).
Every incremental increase transforms additional underwater holders into profit-takers thereby decreasing forced seller pools significantly meaning should market break through those barriers then rapid acceleration towards previously seen levels might precede next major leg higher!

Frequently Asked Questions (FAQ)
- What does it mean for Bitcoin to break out of a descending channel?
- This indicates potential reversal or change in trend direction favoring upward movements rather than downward trends observed previously within said timeframe!
- How does RSI impact trading decisions?
- A rising Relative Strength Index signifies increasing buying pressure suggesting traders may want enter positions while declining values indicate possible selling opportunities depending upon other factors involved too!
- Why are psychological price levels important?
- Psychological thresholds often act as significant barriers due trader behavior patterns based upon historical data influencing overall market sentiment leading up or down movements occurring regularly along these lines!
- What happens if Bitcoin surpasses eighty thousand dollars ($80 K)?
- If surpassed successfully there exists likelihood accelerated demand surge potentially driving valuations much higher thereafter establishing new benchmarks alongside historical norms seen prior periods experienced alike !