
Recent data indicates that companies holding Bitcoin in their treasury have experienced a notable shift, which historically has been associated with bullish market trends.
Previous Bitcoin Treasury Capitulation Inflections Resulted in Bullish Trends
In a recent update on X, Charles Edwards, the founder of Capriole Investments, discussed the current trend regarding the purchasing activities of Bitcoin Digital Asset Treasuries (DATs).
A DAT refers to an organization that retains cryptocurrency on its balance sheet to offer investors exposure to price fluctuations. The predominant strategy among these entities revolves around Bitcoin, recognized as the largest digital asset by market capitalization.
The most well-known figure in this domain is Michael Saylor, whose strategy has involved consistently acquiring Bitcoin even during its bearish phase since Q4 2025.
However, unlike Saylor’s approach, other DATs have not demonstrated similar levels of commitment towards holding this asset. As illustrated in the chart shared by Edwards, there was a noticeable decline in participation from DAT firms during bearish market conditions; particularly sharp drops were observed in April.
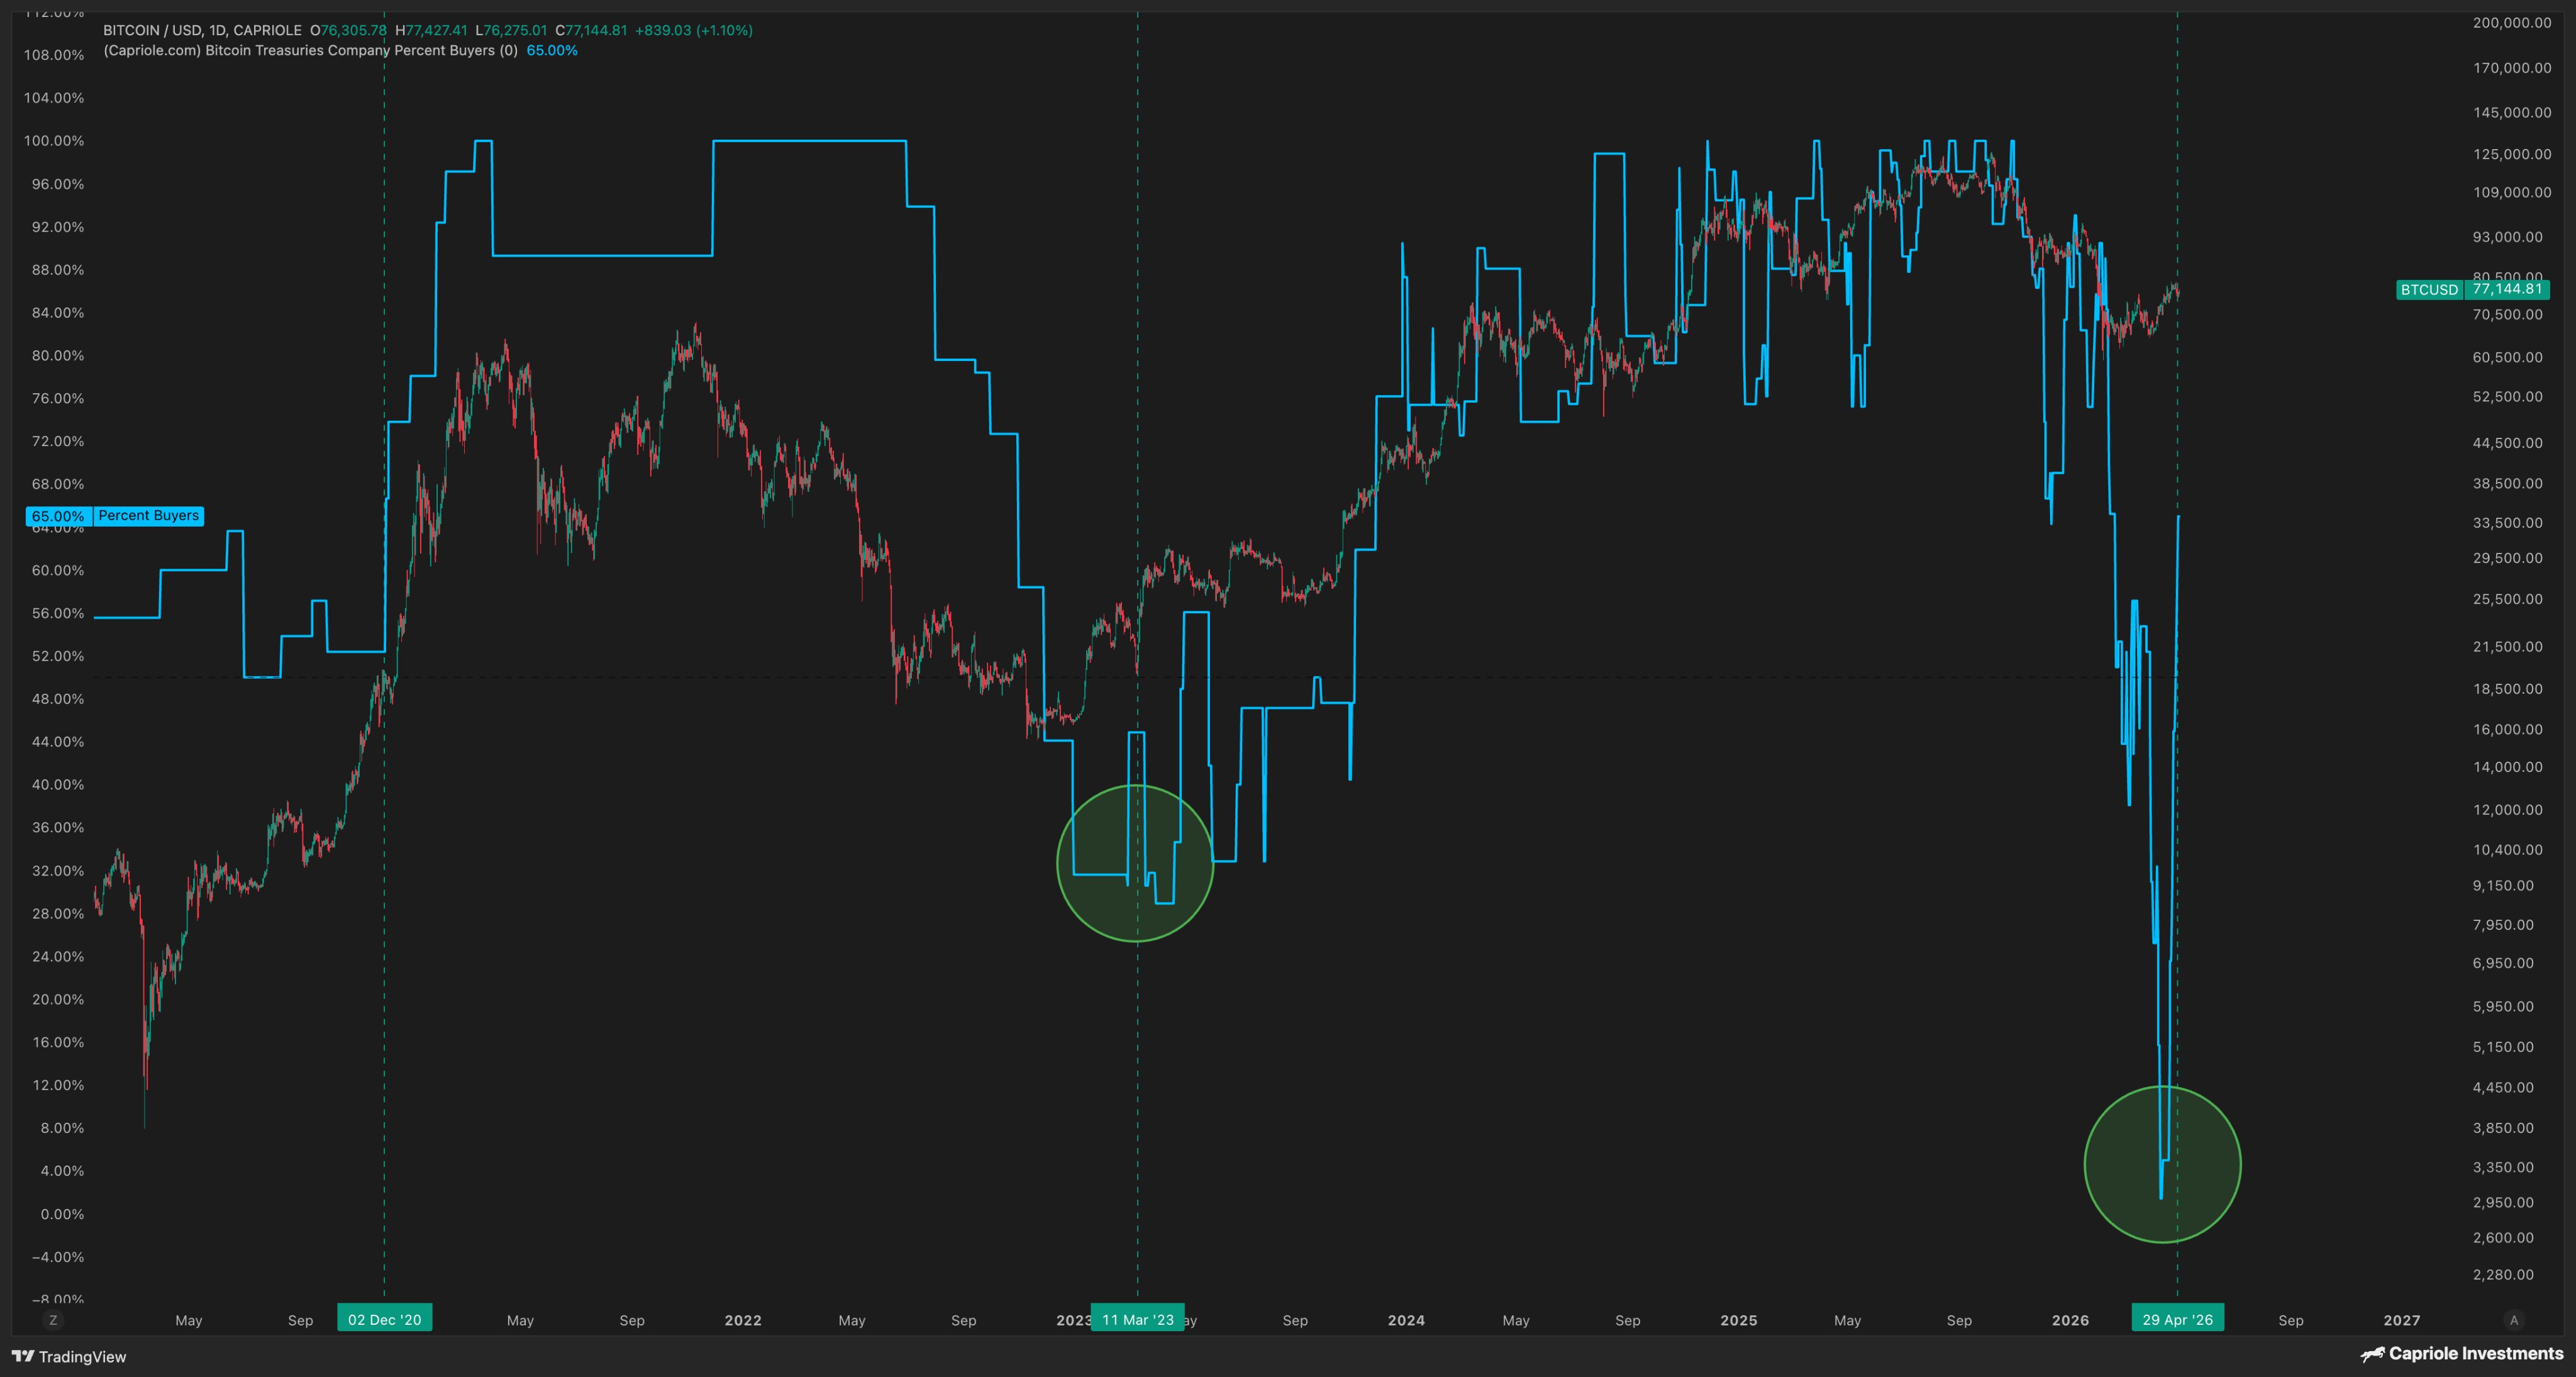
The chart also reveals that following an extreme low point reached in April, there has been a rapid recovery. This could indicate that DATs are approaching an inflection point.
Edwards pointed out previous occurrences of such trends. “These inflections have historically led to bullish outcomes,” he remarked. However, it’s important to note that there isn’t yet enough data for definitive conclusions about whether this time will yield similar results for Bitcoin or if we might see different patterns emerge.
In related news, CryptoQuant—a leading on-chain analytics firm—has highlighted how recent demand for futures contracts has contributed significantly to the recovery of Bitcoin prices via a post on X.
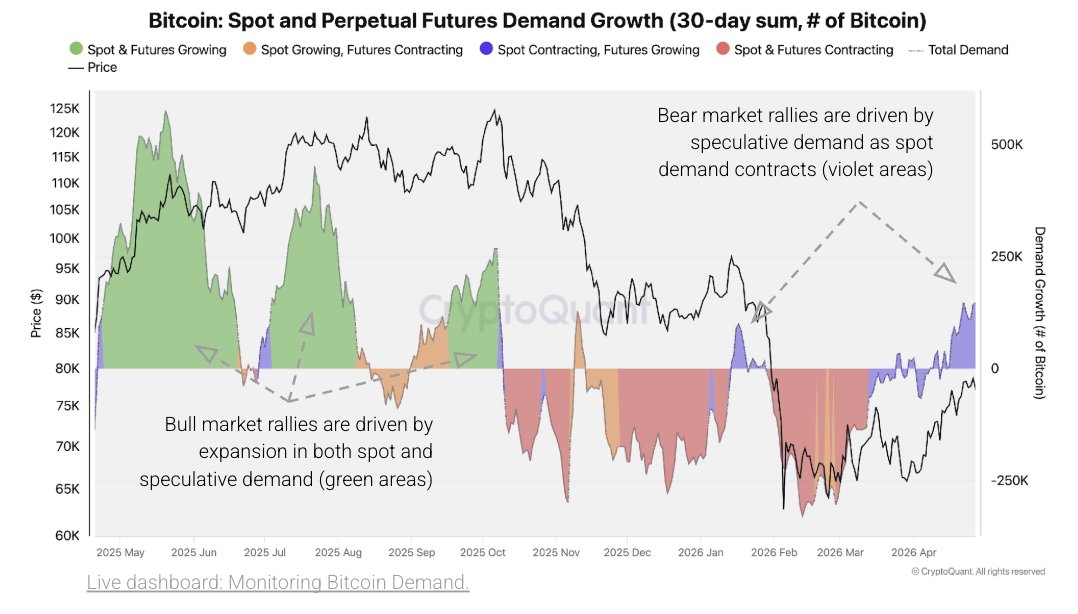
The graph above illustrates that while total demand for Bitcoin has increased lately, individual components show varying trends. Notably, spot demand is contracting; thus indicating derivatives demand is driving overall growth instead.
This pattern mirrors what occurred during January’s recovery rally before it lost momentum. According to CryptoQuant’s analysis—similar structures were noted throughout the 2022 bear market and preceded further declines for $BTC. “While it doesn’t guarantee identical outcomes every time; structurally speaking—it signals bearish tendencies,” stated their report.
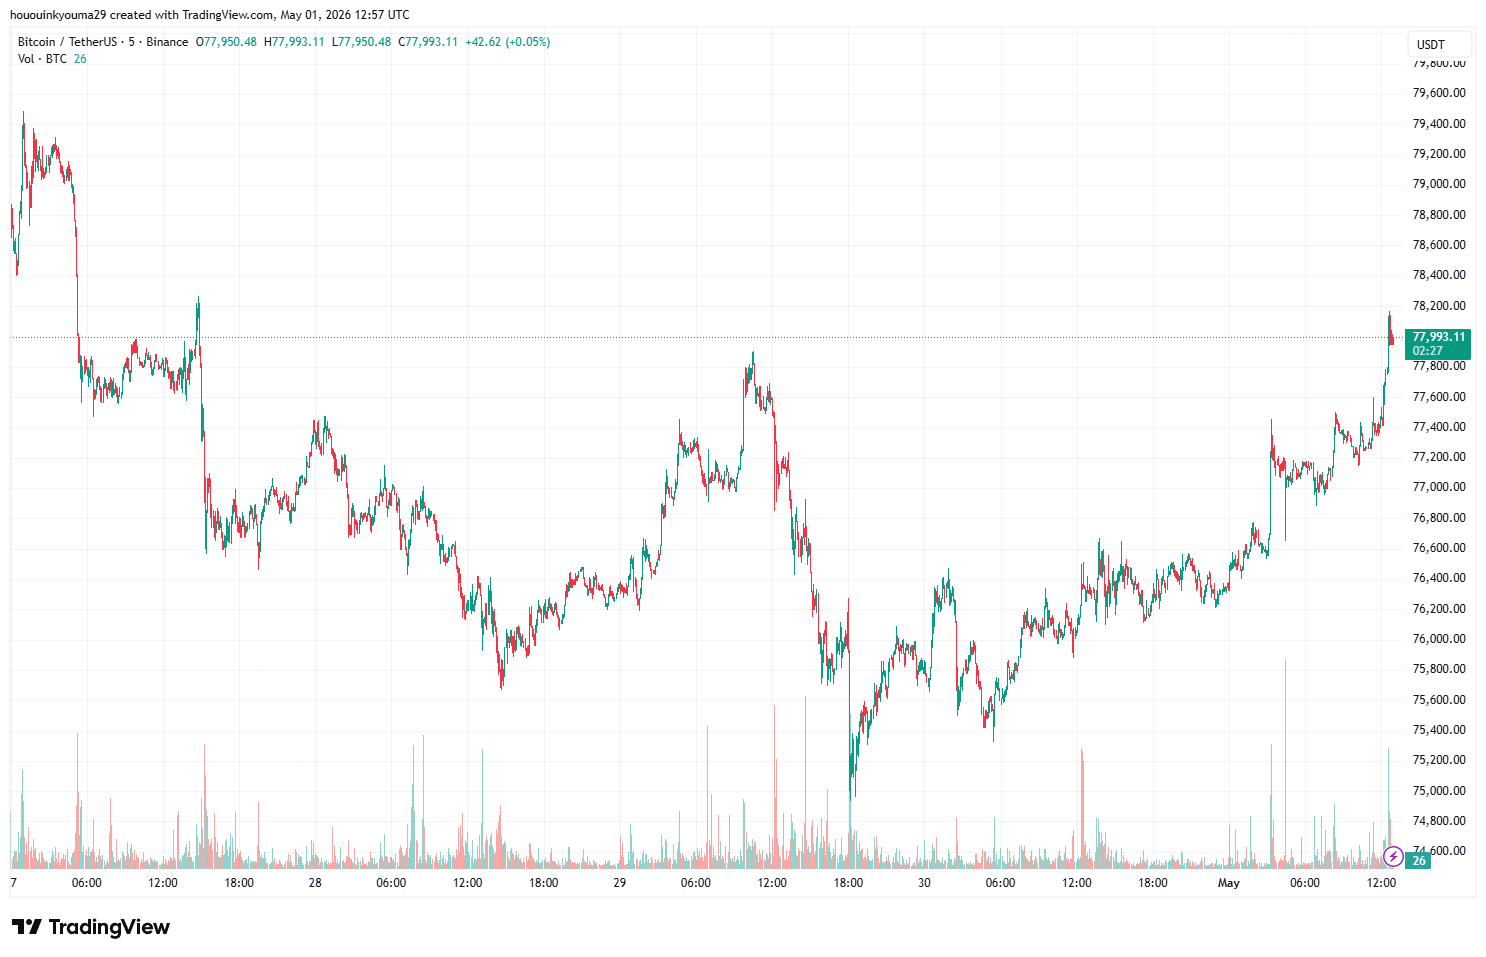
$BTC Price Update
Bitcoin’s price saw an uptick over the past day as it nears $78K once again!
Frequently Asked Questions (FAQ)
- What are Digital Asset Treasuries (DATs)?
- DATS are companies that hold cryptocurrencies like Bitcoin as part of their financial strategy to provide investors with exposure to those assets’ price movements.
- This trend suggests what about future prices?
- This trend may indicate potential bullish action based upon historical patterns observed after similar inflections.
- If spot demand is declining but total demand increases—what does this mean?
- This implies derivatives trading may be driving up overall interest rather than traditional buying methods.
- Could we expect another downturn like seen previously?
- Past structures suggest possible declines ahead but do not guarantee them; caution should always be exercised when investing.