
The support from whale purchases has diminished, and a recurring bearish channel pattern suggests that Bitcoin could potentially decline to $47,400 if critical support levels are breached.
Bitcoin Whales Retreat as $BTC Remains in a Narrow Range
The analysis indicates one significant takeaway: the substantial buy walls beneath $BTC seem to have weakened. Consequently, market depth appears thinner, which typically allows for quicker price movements when pressure builds in either direction.
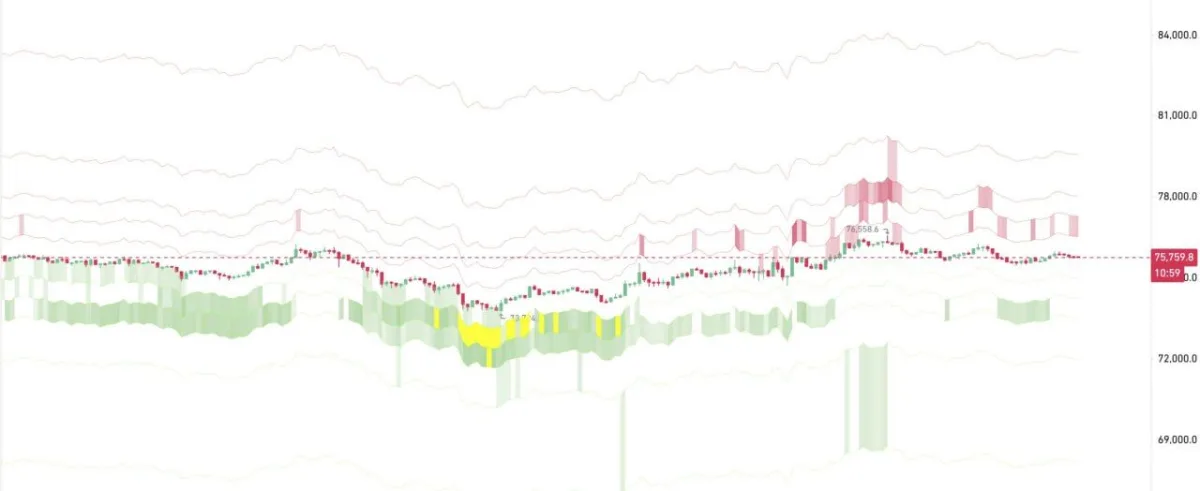
Bitcoin liquidity heatmap. Source: CW on X
Currently, Bitcoin is trading around $75,759 on the chart. Simultaneously, the price remains within a tight range following several brief fluctuations. This is significant because when robust buy orders fade away, the market often loses an essential layer of support. Even slight selling pressure can lead to more rapid declines in price. Conversely, if new demand emerges, prices can surge quickly due to less stable resistance above.
The heatmap further illustrates that recent liquidity clusters above and below current prices have shifted rather than remained solidified. Previously active buyers around the mid-$73k region now appear less convincing as support has weakened. Meanwhile, some sell-side liquidity continues to accumulate higher up between $76k and $78k ranges—indicating potential volatility toward these liquidity pockets.
However, it’s important to note that the chart alone does not confirm any specific direction; it merely implies that a larger movement may be imminent. If $BTC fails to maintain nearby support levels during trading sessions ahead of us—traders will likely monitor whether prices revert back towards lower liquidity zones or not. Should buyers re-enter and regain momentum then there might be another test of upper resistance bands.
The Risk of Bitcoin Channel Breakdown Puts Focus on $47K Level
This chart depicts a recurring pattern for Bitcoin identified by Crypto Patel which could signal another sharp decline ahead; comparing two previous drops near 31% with today’s pricing structure reveals similar trends forming again within an upward-sloping channel—which traders are now observing closely at its lower trendline.
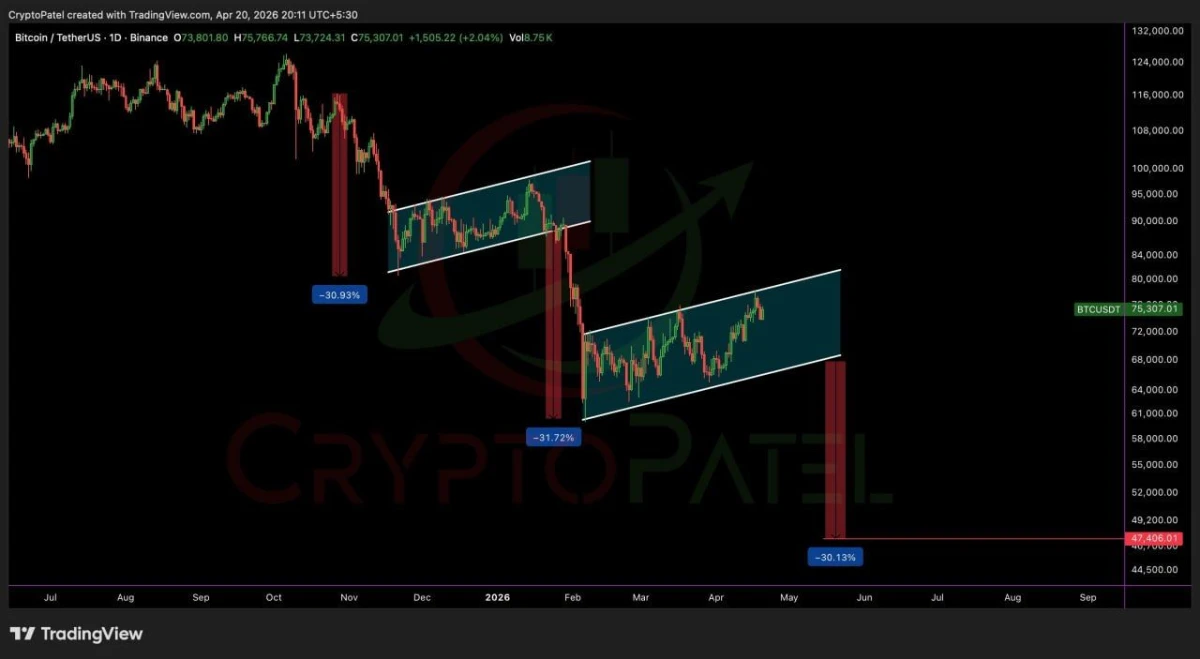
This breakdown scenario for Bitcoin’s rising channel comes from source: Crypto Patel on X.
Pricing currently hovers around $75,307 according this setup showing movement inside an ascending channel after experiencing steep selloffs earlier on charts where similar formations emerged post-heavy drops resulting eventually into breaks below supports leading downwards approximately 30%-31%. Henceforth suggesting yet again should such breaks occur we may witness moves targeting closer towards reaching out at levels like those seen near$47K mark once more!
This bears repeating though—the scenario remains speculative until confirmed outcomes arise! The risk exists should channels fail but presently we remain contained within them so keeping watch over key boundaries becomes crucial here! If $ BTC loses ground amid strong selling pressures then comparisons drawn become increasingly relevant while maintaining itself pushes upwards dilutes overall significance behind setup presented!
p > In summary , this analysis revolves around repeated patterns observed . Thus warning signals suggest potential corrections lie ahead should supports falter ! Until such breakdowns materialize however projections toward reaching out targets like those found near forty-seven thousand dollars stand unconfirmed yet remain viable possibilities nonetheless !