Bitcoin is currently testing a crucial support level after successfully reclaiming the $73,000 to $74,500 range across various time frames. One analysis indicates a potential retest following a breakout, while another reveals that previous resistance levels are beginning to function as support.
Focus Shifts Back to $73K Retest After Weekly Close
According to insights shared by X user Rekt Capital, Bitcoin appears poised for a retest of the breakout zone around $73,000 after facing another weekly rejection at the 21-week EMA. The chart illustrates how the green 21-week EMA is acting as overhead resistance while key horizontal levels at approximately $72,810 and $65,710 represent significant structures from an earlier double bottom pattern. This scenario places Bitcoin in a technical position where any pullback could reinforce the broader breakout narrative rather than undermine it.
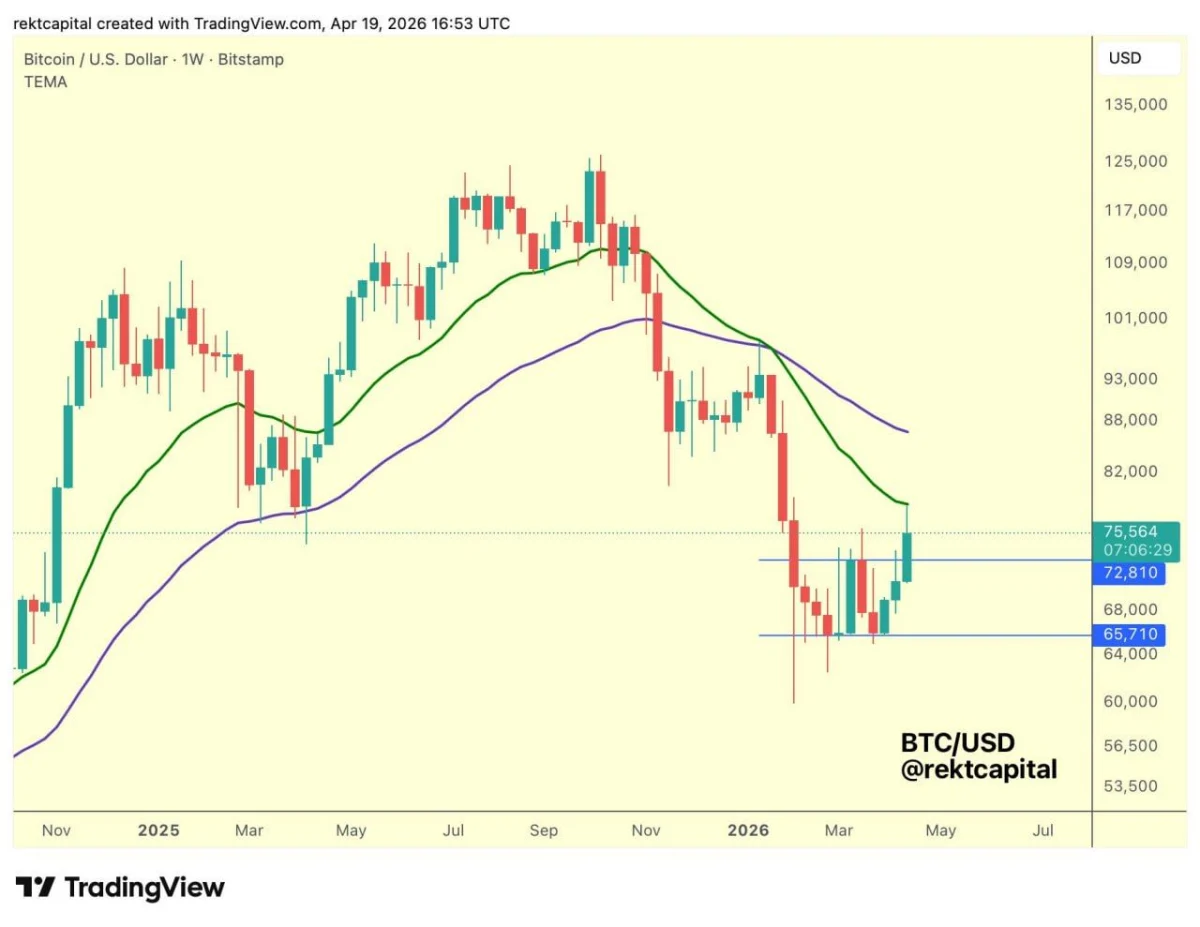
Source: TradingView / Rekt Capital
The chart indicates that $BTC recently rebounded from its lower blue support area near $65,700 and moved back towards the upper blue level around $72,800. However, since prices remain below the green 21-week EMA, it suggests that this moving average has not yet been fully reclaimed by market participants. Rekt Capital notes that if this weekly close persists in being below this EMA line it could signify resistance rather than support.
If such conditions prevail, Bitcoin might revisit its top double bottom formation near $73K for testing purposes—a typical post-breakout retest scenario. These retests are critical as they determine whether prior resistances can now serve effectively as supports; if buyers manage to defend this area successfully then it strengthens the overall breakout structure.
The chart also implies that although recent rebounds have bolstered short-term momentum slightly—it’s insufficient to alter higher timeframe perspectives significantly. While $BTC has made notable recoveries since March lows—the green EMA remains above current price action and continues on a downward slope indicating ongoing recovery instead of an established trend reversal.
Additonally,the lower blue band around$65 ,700 serves as deeper supportive territory should initial retests falter.A sustained hold above upper blue zones would preserve breakouts logic intact; however,a drop beneath would elevate risks associated with returning into broader trading ranges.
The overall perspective provided by these charts aligns with Rekt Capital’s assertion regarding Bitcoin nearing pivotal weekly thresholds.Rejections against 21 week EMAs may prompt healthy re-tests close towards$73k;if successful,this would lend credibility toward confirming double-bottom breakouts more convincingly .
$74.5K Becomes Key Support Zone on Daily Chart for Bitcoin
A daily chart presented by X user Super฿ro suggests that Bitcoin might be establishing solid support near$74 ,500 due several technical indicators converging within proximity.This setup showcases both2025 lows alongside0 .382 Fibonacci retracement levels combined with100-day simple moving averages clustering closely together—indicating these former resistances transitioning into prospective supports now .
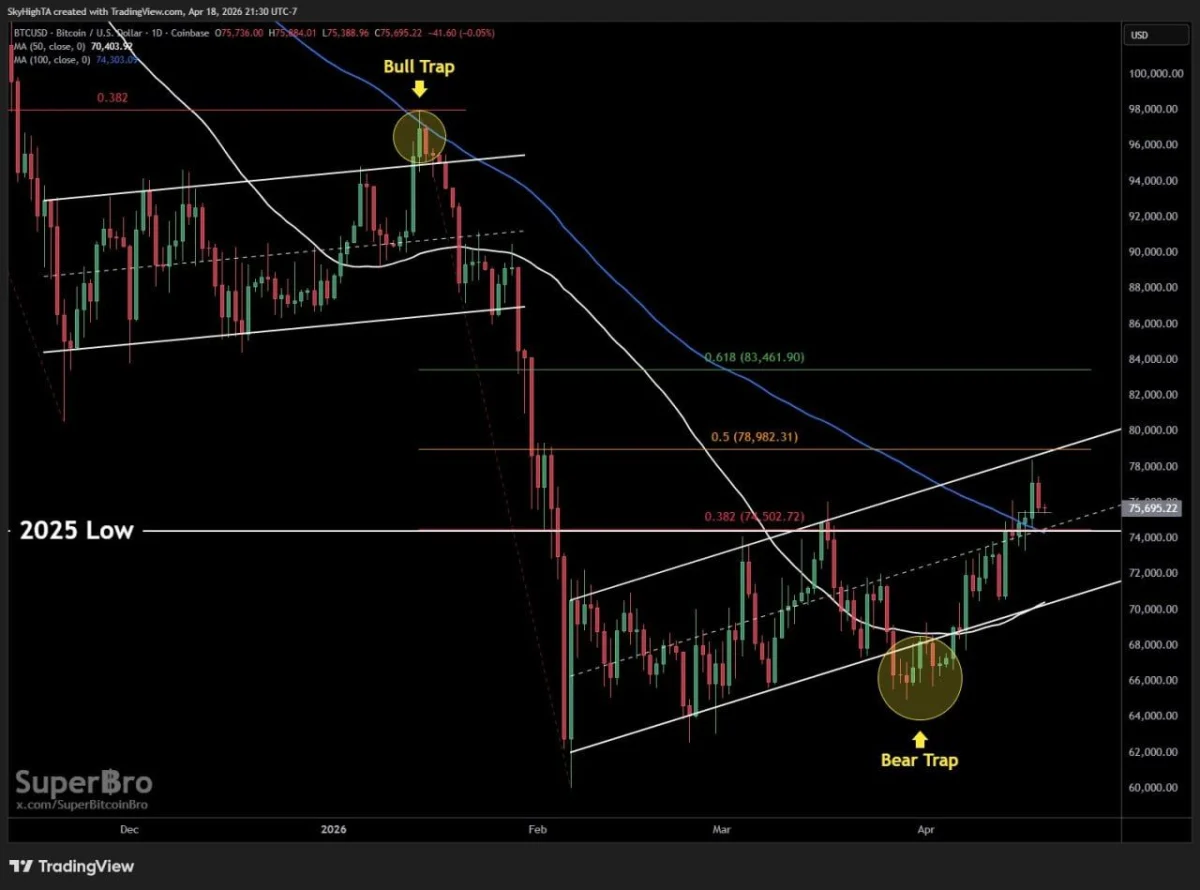
Source: TradingView / Super฿ro
This analysis also depicts how bitcoin trades inside an ascending structure following sharp declines experienced early February.Moreover,recently prices pushed past red horizontal lines hovering around$74 ,502 maintaining stability instead of retreating back downwards —signifying significance because past resistances often become vital tests during recovery phases like these.
Super฿ro further highlighted last weekend’s low-volume sell-off which quickly reversed through strong bullish movements seen Monday indicating sellers failed retaining control over declining trends allowing buyers regaining momentum surrounding same supportive clusters observed earlier.
However,the overhead pressures still persist evidenced through existing positions remaining under higher Fibonacci ranges located roughly between78 ,982and83 ,461 whilst200-day moving averages trending above current pricing action.As such despite improvements seen surrounding94 K BTC still requires robust follow-throughs before confidently reclaiming next resistant zones ahead .
Broader structural context adds depth concerning moves witnessed previously.Bull traps occurring late2025 were succeeded subsequently followed deep corrections while bear traps formed April lows before rebound began.Since then,BTC climbed back towards middle range attempting stabilize above areas previously capping market activity.